

Question: Use the data in problem 9 to create a Pareto diagram 9. In an apparel factory, every time a sewing machine breaks, the symptom is
Use the data in problem 9 to create a Pareto diagram 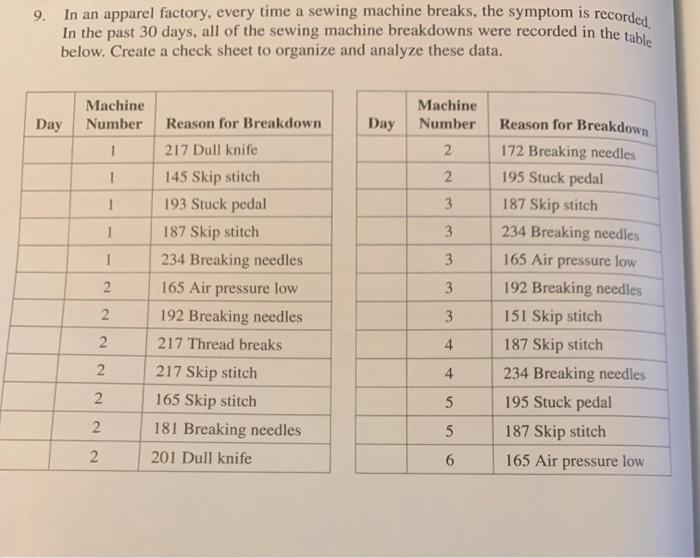
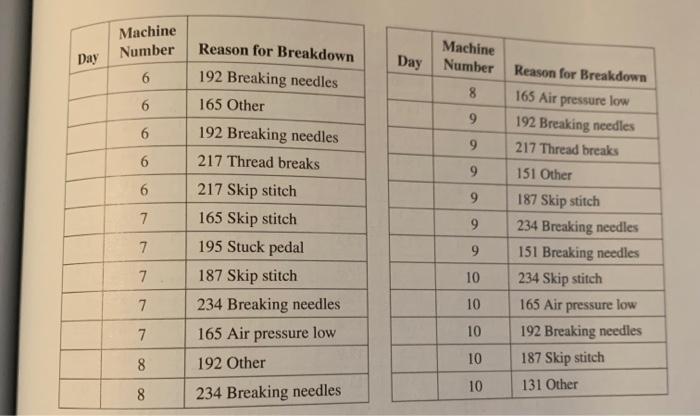
9. In an apparel factory, every time a sewing machine breaks, the symptom is recorded, In the past 30 days, all of the sewing machine breakdowns were recorded in the table . below. Create a check sheet to organize and analyze these data. Day Machine Number 1 Reason for Breakdown Day Machine Number 2 1 1 2 3 3 3 1 3 1 3 2 3 217 Dull knife 145 Skip stitch 193 Stuck pedal 187 Skip stitch 234 Breaking needles 165 Air pressure low 192 Breaking needles 217 Thread breaks 217 Skip stitch 165 Skip stitch 181 Breaking needles 201 Dull knife Reason for Breakdown 172 Breaking needles 195 Stuck pedal 187 Skip stitch 234 Breaking needles 165 Air pressure low 192 Breaking needles 151 Skip stitch 187 Skip stitch 234 Breaking needles 195 Stuck pedal 187 Skip stitch 165 Air pressure low 2 3 2 4 4. 2 2. 2 5 2. 5 2 2 6 Machine Number Day Day Machine Number 6 8 6 Reason for Breakdown 192 Breaking needles 165 Other 192 Breaking needles 217 Thread breaks Reason for Breakdown 165 Air pressure low 192 Breaking needles 217 Thread breaks 9 6 9 6 9 151 Other 6 9 7 9 7 9 7 217 Skip stitch 165 Skip stitch 195 Stuck pedal 187 Skip stitch 234 Breaking needles 165 Air pressure low 192 Other 10 187 Skip stitch 234 Breaking needles 151 Breaking needles 234 Skip stitch 165 Air pressure low 192 Breaking needles 187 Skip stitch 131 Other 7 10 7 10 8 10 10 8 234 Breaking needles Step by Step Solution
There are 3 Steps involved in it
1 Expert Approved Answer
Step: 1 Unlock

Question Has Been Solved by an Expert!
Get step-by-step solutions from verified subject matter experts
Step: 2 Unlock
Step: 3 Unlock