

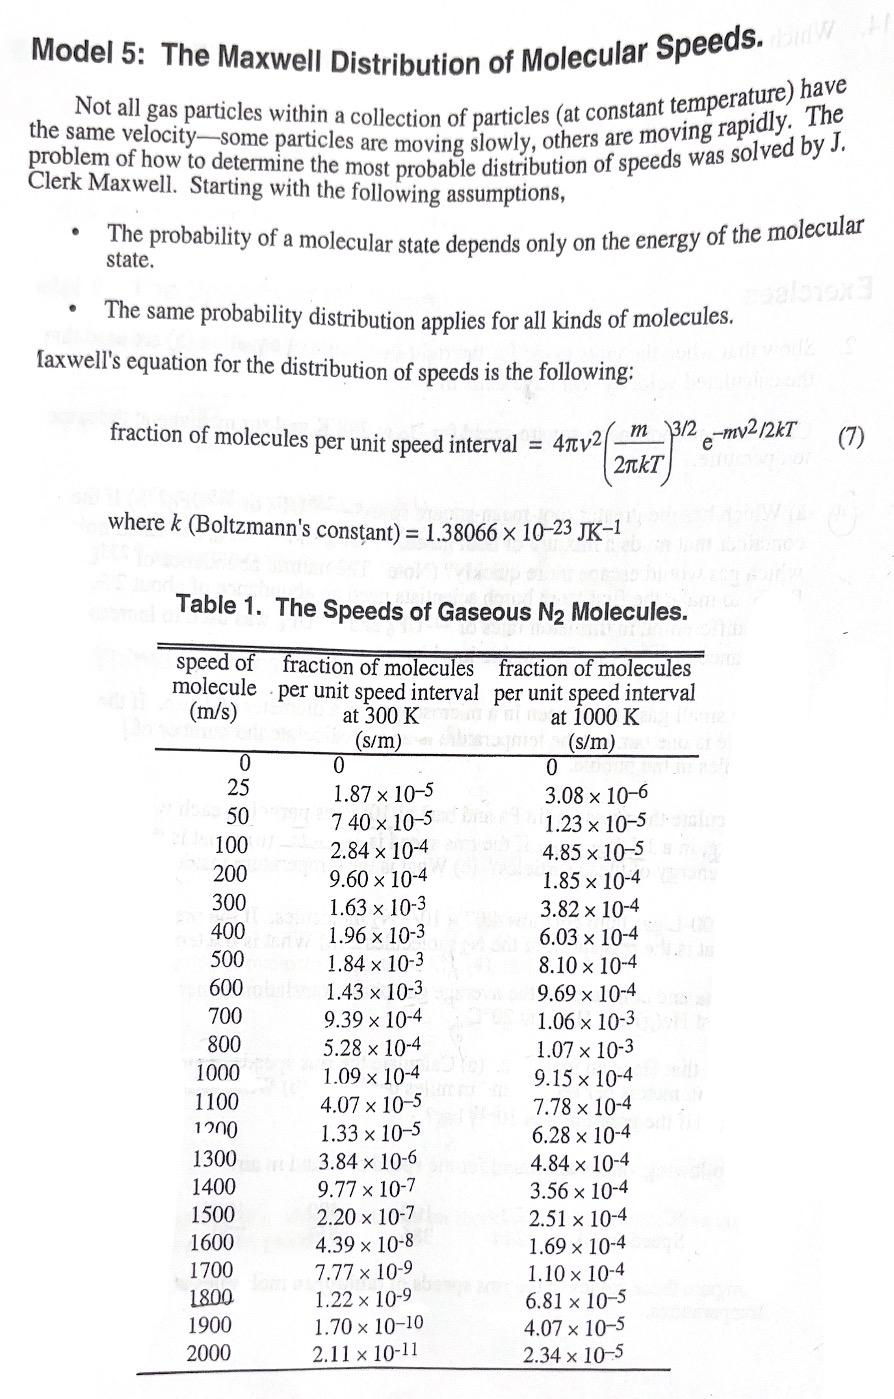
Question: Use the data in Table 1 to prepare a plot of the fraction of molecules per unit speedinterval vs . speed for N 2 gas
Use the data in Table to prepare a plot of the fraction of molecules per unit speedinterval vs speed for N gas at K Indicate the mostprobable speed, theaverage speed, and the rootmeansquare speed on the graph. Plot the data at K on the same graph. Indicate the most probable speed, the average speed, and therootmeansquare speed on the graph. Sketch the fraction of molecules per unitspeed interval vs speed for N gas at K on the same graph.
Step by Step Solution
There are 3 Steps involved in it
1 Expert Approved Answer
Step: 1 Unlock

Question Has Been Solved by an Expert!
Get step-by-step solutions from verified subject matter experts
Step: 2 Unlock
Step: 3 Unlock