

Question: Use the data in Table 5.4 to construct a Gantt chart and calculate the various performance metrics for Round Robin scheduling Table 5.4 CPU Service
Use the data in Table 5.4 to construct a Gantt chart and calculate the various performance metrics for Round Robin scheduling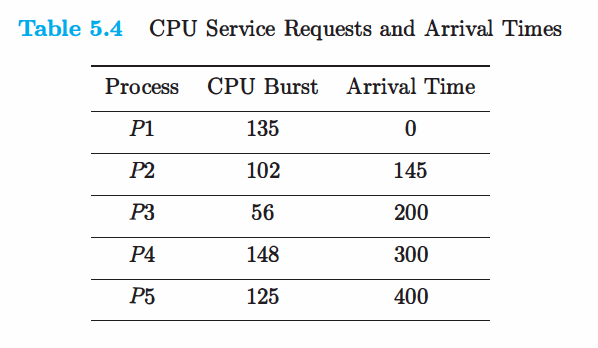
Table 5.4 CPU Service Requests and Arrival Times Process CPU Burst Arrival Time P1 P2 P3 P4 P5 135 102 56 148 125 0) 145 200 300 400
Step by Step Solution
There are 3 Steps involved in it
1 Expert Approved Answer
Step: 1 Unlock

Question Has Been Solved by an Expert!
Get step-by-step solutions from verified subject matter experts
Step: 2 Unlock
Step: 3 Unlock