

Question: use the data in tables below to answer the above table Financial analysis income statment balance sheet Average at 2019 2020 2021 2022 2023 2024
use the data in tables below to answer the above table
Financial analysis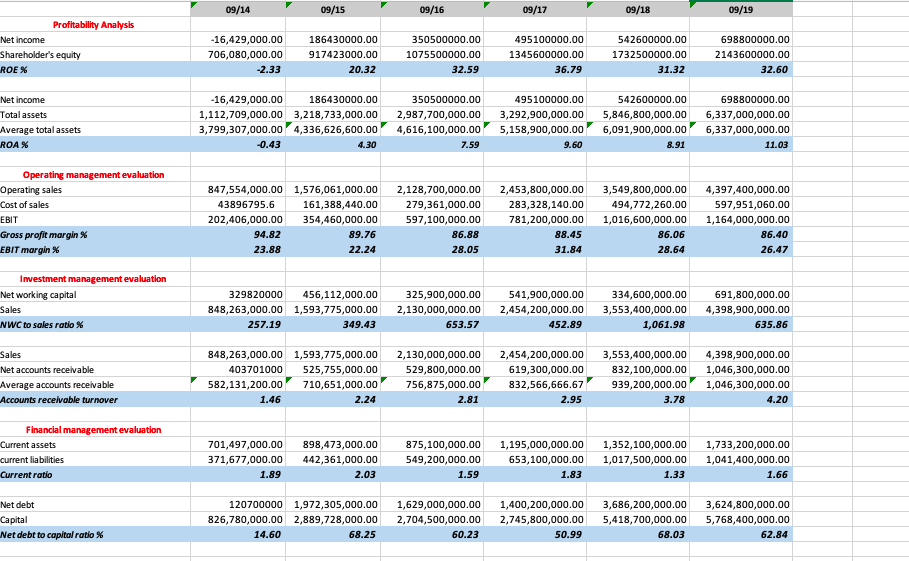
income statment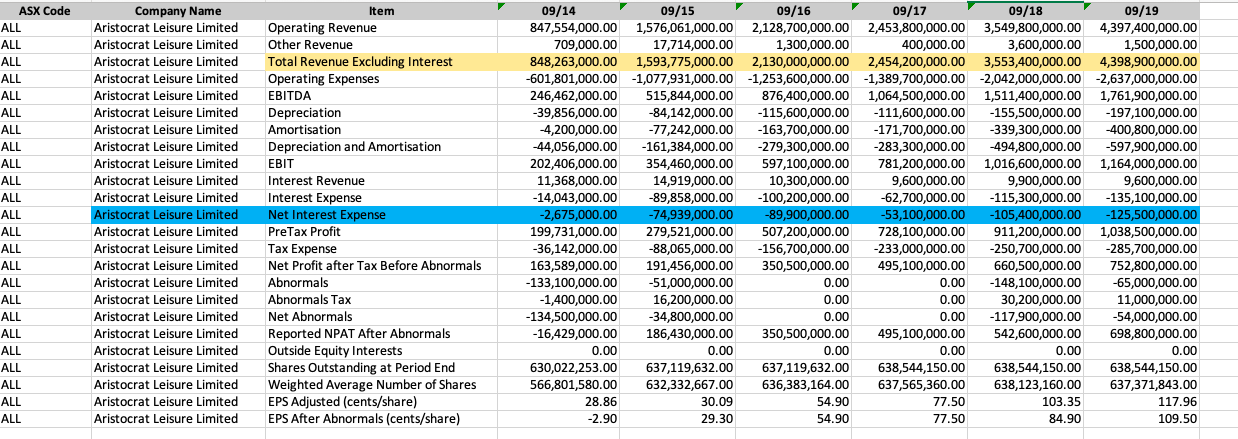
balance sheet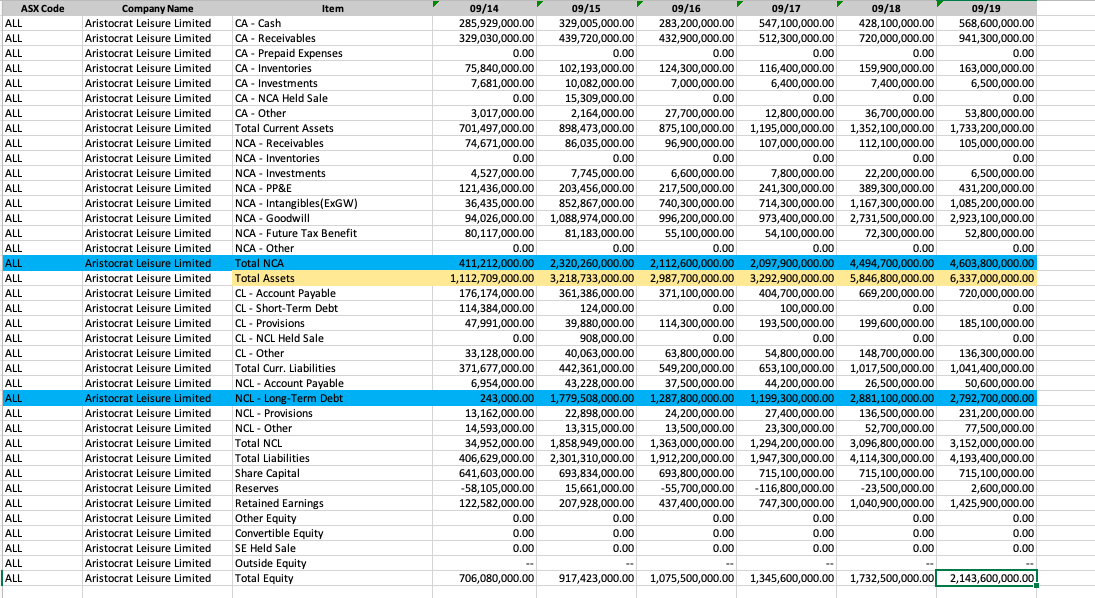
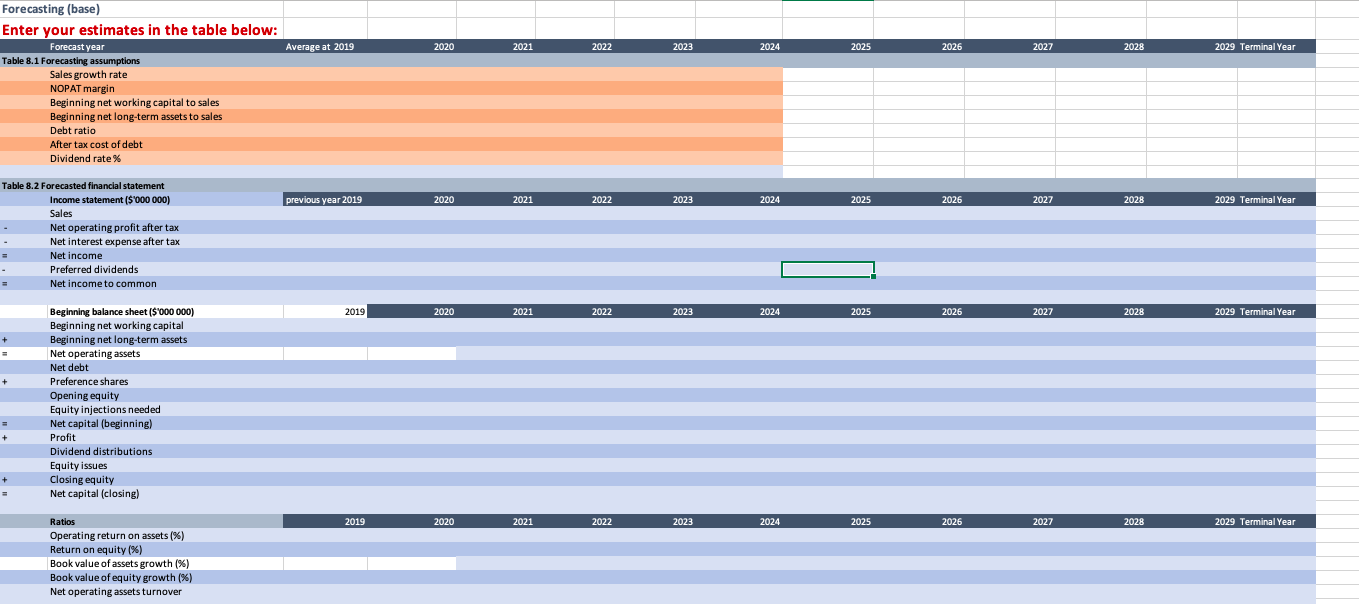
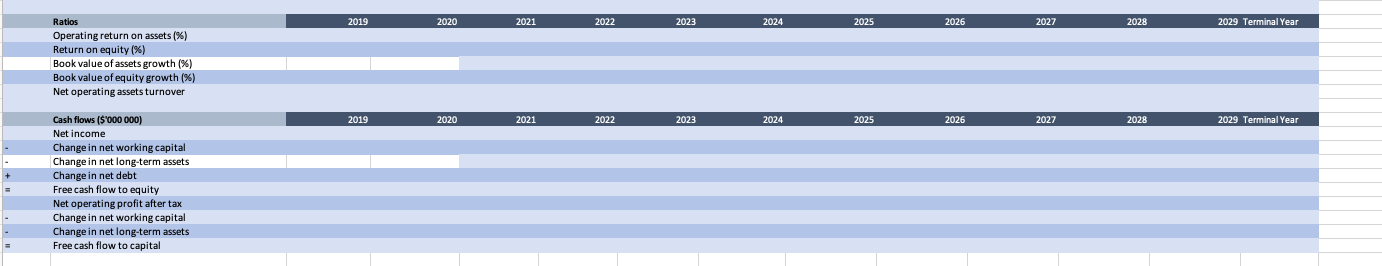
Average at 2019 2020 2021 2022 2023 2024 2025 2026 2027 2028 2029 Terminal Year Forecasting (base) Enter your estimates in the table below: Forecast year Table 8.1 Forecasting assumptions Sales growth rate NOPAT margin Beginning networking capital to sales Beginning net long-term assets to sales Debt ratio After tax cost of debt Dividend rate % previous year 2019 2020 2021 2022 2023 2024 2025 2026 2027 2028 2029 Terminal Year Table 8.2 Forecasted financial statement Income statement ($ 000 000) Sales Net operating profit after tax Net interest expense after tax = Net income Preferred dividends Net income to common 2019 2020 2021 2022 2023 2024 2025 2026 2027 2028 2029 Terminal Year + = + Beginning balance sheet ($ 000 000) Beginning networking capital Beginning net long-term assets Net operating assets Net debt Preference shares Opening equity Equity injections needed Net capital (beginning) Profit Dividend distributions Equity issues Closing equity Net capital (closing) + + = 2019 2020 2021 2022 2023 2024 2025 2026 2027 2028 2029 Terminal Year Ratios Operating return on assets (%) Return on equity (%) Book value of assets growth (%) Book value of equity growth (%) Net operating assets turnover 2019 2020 2021 2022 2023 2024 2025 2026 2027 2028 2029 Terminal Year Ratios Operating return on assets (%) Return on equity (%) Book value of assets growth (%) Book value of equity growth (%) Net operating assets turnover 2019 2020 2021 2022 2023 2024 2025 2026 2027 2028 2029 Terminal Year - Cash flows ($ 000 000) Net Income Change in net working capital Change in net long-term assets Change in net debt Free cash flow to equity Net operating profit after tax Change in net working capital Change in net long-term assets Free cash flow to capital 09/14 09/15 09/16 09/17 09/18 09/19 Profitability Analysis Net income Shareholder's equity ROE % -16,429,000.00 706,080,000.00 -2.33 186430000.00 917423000.00 20.32 350500000.00 1075500000.00 32.59 495100000.00 1345600000.00 36.79 542600000.00 1732500000.00 31.32 698800000.00 2143600000.00 32.60 Net income Total assets Average total assets ROA% -16,429,000.00 186430000.00 1,112,709,000.00 3,218,733,000.00 3,799,307,000.00 4,336,626,600.00 -0.43 4.30 350500000.00 2,987,700,000.00 4,616,100,000.00 7.59 495100000.00 3,292,900,000.00 5,158,900,000.00 9.60 542600000.00 5,846,800,000.00 6,091,900,000.00 8.91 698800000.00 6,337,000,000.00 6,337,000,000.00 11.03 Operating management evaluation Operating sales Cost of sales EBIT 847,554,000.00 1,576,061,000.00 43896795.6 161,388,440.00 202,406,000.00 354,460,000.00 94.82 89.76 23.88 22.24 2,128,700,000.00 279,361,000.00 597,100,000.00 86.88 28.05 2,453,800,000.00 283,328,140.00 781,200,000.00 88.45 31.84 3,549,800,000.00 494,772,260.00 1,016,600,000.00 86.06 28.64 4,397,400,000.00 597,951,060.00 1,164,000,000.00 86.40 26.47 Gross profit margin % EBIT margin% Investment management evaluation Net working capital Sales 329820000 456,112,000.00 848,263,000.00 1,593,775,000.00 257.19 349.43 325,900,000.00 2,130,000,000.00 653.57 541,900,000.00 2,454,200,000.00 452.89 334,600,000.00 3,553,400,000.00 1,061.98 691,800,000.00 4,398,900,000.00 635.86 NWC to sales ratio % Sales Net accounts receivable Average accounts receivable Accounts receivable turnover 848,263,000.00 1,593,775,000.00 403701000 525,755,000.00 582,131,200.00 710,651,000.00 1.46 2.24 2,130,000,000.00 529,800,000.00 756,875,000.00 2.81 2,454,200,000.00 619,300,000.00 832,566,666.67 2.95 3,553,400,000.00 832,100,000.00 939,200,000.00 3.78 4,398,900,000.00 1,046,300,000.00 1,046,300,000.00 4.20 Financial management evaluation Current assets current liabilities Current ratio 701,497,000.00 371,677,000.00 1.89 898,473,000.00 442,361,000.00 2.03 875,100,000.00 549,200,000.00 1.59 1,195,000,000.00 653,100,000.00 1.83 1,352,100,000.00 1,017,500,000.00 1.33 1,733,200,000.00 1,041,400,000.00 1.66 Net debt Capital Net debt to capital ratio 120700000 1,972,305,000.00 826,780,000.00 2,889,728,000.00 14.60 68.25 1,629,000,000.00 2,704,500,000.00 60.23 1,400,200,000.00 2,745,800,000.00 50.99 3,686,200,000.00 5,418,700,000.00 68.03 3,624,800,000.00 5,768,400,000.00 62.84 ASX Code ALL ALL ALL ALL ALL ALL ALL ALL ALL ALL ALL ALL ALL ALL ALL ALL ALL ALL ALL ALL ALL ALL ALL ALL Company Name Aristocrat Leisure Limited Aristocrat Leisure Limited Aristocrat Leisure Limited Aristocrat Leisure Limited Aristocrat Leisure Limited Aristocrat Leisure Limited Aristocrat Leisure Limited Aristocrat Leisure Limited Aristocrat Leisure Limited Aristocrat Leisure Limited Aristocrat Leisure Limited Aristocrat Leisure Limited Aristocrat Leisure Limited Aristocrat Leisure Limited Aristocrat Leisure Limited Aristocrat Leisure Limited Aristocrat Leisure Limited Aristocrat Leisure Limited Aristocrat Leisure Limited Aristocrat Leisure Limited Aristocrat Leisure Limited Aristocrat Leisure Limited Aristocrat Leisure Limited Aristocrat Leisure Limited Item Operating Revenue Other Revenue Total Revenue Excluding Interest Operating Expenses EBITDA Depreciation Amortisation Depreciation and Amortisation EBIT Interest Revenue Interest Expense Net Interest Expense PreTax Profit Tax Expense Net Profit after Tax Before Abnormals Abnormals Abnormals Tax Net Abnormals Reported NPAT After Abnormals Outside Equity Interests Shares Outstanding at Period End Weighted Average Number of Shares EPS Adjusted (cents/share) EPS After Abnormals (cents/share) 09/14 09/15 09/16 09/17 09/18 09/19 847,554,000.00 1,576,061,000.00 2,128,700,000.00 2,453,800,000.00 3,549,800,000.00 4,397,400,000.00 709,000.00 17,714,000.00 1,300,000.00 400,000.00 3,600,000.00 1,500,000.00 848,263,000.00 1,593,775,000.00 2,130,000,000.00 2,454,200,000.00 3,553,400,000.00 4,398,900,000.00 -601,801,000.00 -1,077,931,000.00 -1,253,600,000.00 -1,389,700,000.00 -2,042,000,000.00 -2,637,000,000.00 246,462,000.00 515,844,000.00 876,400,000.00 1,064,500,000.00 1,511,400,000.00 1,761,900,000.00 -39,856,000.00 -84,142,000.00 -115,600,000.00 -111,600,000.00 -155,500,000.00 -197,100,000.00 4,200,000.00 -77,242,000.00 -163,700,000.00 -171,700,000.00 -339,300,000.00 -400,800,000.00 -44,056,000.00 -161,384,000.00 -279,300,000.00 -283,300,000.00 -494,800,000.00 -597,900,000.00 202,406,000.00 354.460,000.00 597,100,000.00 781,200,000.00 1,016,600,000.00 1,164,000,000.00 11,368,000.00 14,919,000.00 10,300,000.00 9,600,000.00 9,900,000.00 9,600,000.00 -14,043,000.00 -89,858,000.00 -100,200,000.00 -62,700,000.00 -115,300,000.00 -135,100,000.00 -2,675,000.00 -74,939,000.00 -89,900,000.00 -53,100,000.00 -105,400,000.00 -125,500,000.00 199,731,000.00 279,521,000.00 507,200,000.00 728,100,000.00 911,200,000.00 1,038,500,000.00 -36,142,000.00 -88,065,000.00 -156,700,000.00 -233,000,000.00 -250,700,000.00 -285,700,000.00 163,589,000.00 191,456,000.00 350,500,000.00 495,100,000.00 660,500,000.00 752,800,000.00 -133,100,000.00 -51,000,000.00 0.00 0.00 -148,100,000.00 -65,000,000.00 -1,400,000.00 16,200,000.00 0.00 0.00 30,200,000.00 11,000,000.00 -134,500,000.00 -34,800,000.00 0.00 0.00 -117,900,000.00 -54,000,000.00 -16,429,000.00 186,430,000.00 350,500,000.00 495,100,000.00 542,600,000.00 698,800,000.00 0.00 0.00 0.00 0.00 0.00 0.00 630,022,253.00 637,119,632.00 637,119,632.00 638,544,150.00 638,544,150.00 638,544,150.00 566,801,580.00 632,332,667.00 636,383,164.00 637,565,360.00 638,123,160.00 637,371,843.00 28.86 30.09 54.90 77.50 103.35 117.96 -2.90 29.30 54.90 77.50 84.90 109.50 ASX Code ALL ALL ALL ALL ALL ALL ALL ALL ALL ALL ALL ALL ALL ALL ALL ALL ALL ALL ALL ALL ALL ALL ALL ALL ALL ALL ALL ALL ALL ALL ALL ALL ALL ALL ALL ALL ALL JALL Company Name Aristocrat Leisure Limited Aristocrat Leisure Limited Aristocrat Leisure Limited Aristocrat Leisure Limited Aristocrat Leisure Limited Aristocrat Leisure Limited Aristocrat Leisure Limited Aristocrat Leisure Limited Aristocrat Leisure Limited Aristocrat Leisure Limited Aristocrat Leisure Limited Aristocrat Leisure Limited Aristocrat Leisure Limited Aristocrat Leisure Limited Aristocrat Leisure Limited Aristocrat Leisure Limited Aristocrat Leisure Limited Aristocrat Leisure Limited Aristocrat Leisure Limited Aristocrat Leisure Limited Aristocrat Leisure Limited Aristocrat Leisure Limited Aristocrat Leisure Limited Aristocrat Leisure Limited Aristocrat Leisure Limited Aristocrat Leisure Limited Aristocrat Leisure Limited Aristocrat Leisure Limited Aristocrat Leisure Limited Aristocrat Leisure Limited Aristocrat Leisure Limited Aristocrat Leisure Limited Aristocrat Leisure Limited Aristocrat Leisure Limited Aristocrat Leisure Limited Aristocrat Leisure Limited Aristocrat Leisure Limited Aristocrat Leisure Limited Item CA-Cash CA-Receivables CA - Prepaid Expenses CA - Inventories CA - Investments CA - NCA Held Sale CA - Other Total Current Assets NCA - Receivables NCA - Inventories NCA - Investments NCA - PP&E NCA - Intangibles(ExGW) NCA - Goodwill NCA - Future Tax Benefit NCA - Other Total NCA Total Assets CL - Account Payable CL - Short-Term Debt CL - Provisions CL - NCL Held Sale CL - Other Total Curr. Liabilities NCL - Account Payable NCL - Long-Term Debt NCL - Provisions NCL - Other Total NCL Total Liabilities Share Capital Reserves Retained Earnings Other Equity Convertible Equity SE Held Sale Outside Equity Total Equity 09/14 09/15 09/16 09/17 09/18 09/19 285,929,000.00 329,005,000.00 283,200,000.00 547,100,000.00 428,100,000.00 568,600,000.00 329,030,000.00 439,720,000.00 432,900,000.00 512,300,000.00 720,000,000.00 941,300,000.00 0.00 0.00 0.00 0.00 0.00 0.00 75,840,000.00 102,193,000.00 124,300,000.00 116,400,000.00 159,900,000.00 163,000,000.00 7,681,000.00 10,082,000.00 7,000,000.00 6,400,000.00 7,400,000.00 6,500,000.00 0.00 15,309,000.00 0.00 0.00 0.00 0.00 3,017,000.00 2.164,000.00 27,700,000.00 12,800,000.00 36,700,000.00 53,800,000.00 701,497,000.00 898,473,000.00 875,100,000.00 1,195,000,000.00 1,352,100,000.00 1,733,200,000.00 74,671,000.00 86,035,000.00 96,900,000.00 107,000,000.00 112,100,000.00 105,000,000.00 0.00 0.00 0.00 0.00 0.00 0.00 4,527,000.00 7,745,000.00 6,600,000.00 7,800,000.00 22,200,000.00 6,500,000.00 121,436,000.00 203,456,000.00 217,500,000.00 241,300,000.00 389,300,000.00 431,200,000.00 36,435,000.00 852,867,000.00 740,300,000.00 714,300,000.00 1,167,300,000.00 1,085,200,000.00 94,026,000.00 1,088,974,000.00 996,200,000.00 973,400,000.00 2,731,500,000.00 2,923,100,000.00 80,117,000.00 81,183,000.00 55,100,000.00 54,100,000.00 72,300,000.00 52,800,000.00 0.00 0.00 0.00 0.00 0.00 0.00 411,212,000.00 2,320,260,000.00 2,112,600,000.00 2,097,900,000.00 4,494,700,000.00 4,603,800,000.00 1,112,709,000.00 3,218,733,000.00 2,987,700,000.00 3,292,900,000.00 5,846,800,000.00 6,337,000,000.00 176,174,000.00 361,386,000.00 371,100,000.00 404,700,000.00 669,200,000.00 720,000,000.00 114,384,000.00 124,000.00 0.00 100,000.00 0.00 0.00 47,991,000.00 39,880,000.00 114,300,000.00 193,500,000.00 199,600,000.00 185,100,000.00 0.00 908,000.00 0.00 0.00 0.00 0.00 33,128,000.00 40,063,000.00 63,800,000.00 54,800,000.00 148,700,000.00 136,300,000.00 371,677,000.00 442,361,000.00 549,200,000.00 653,100,000.00 1,017,500,000.00 1,041,400,000.00 6,954,000.00 43,228,000.00 37,500,000.00 44,200,000.00 26,500,000.00 50,600,000.00 243,000.00 1,779,508,000.00 1,287,800,000.00 1,199,300,000.00 2,881,100,000.00 2,792,700,000.00 13,162,000.00 22,898,000.00 24,200,000.00 27,400,000.00 136,500,000.00 231,200,000.00 14,593,000.00 13,315,000.00 13,500,000.00 23,300,000.00 52,700,000.00 77,500,000.00 34,952,000.00 1,858,949,000.00 1,363,000,000.00 1,294,200,000.00 3,096,800,000.00 3,152,000,000.00 406,629,000.00 2,301,310,000.00 1,912,200,000.00 1,947,300,000.00 4,114,300,000.00 4,193,400,000.00 641,603,000.00 693,834,000.00 693,800,000.00 715,100,000.00 715,100,000.00 715,100,000.00 -58,105,000.00 15,661,000.00 -55,700,000.00 -116,800,000.00 -23,500,000.00 2,600,000.00 122,582,000.00 207,928,000.00 437,400,000.00 747,300,000.00 1,040,900,000.00 1,425,900,000.00 0.00 0.00 0.00 0.00 0.00 0.00 0.00 0.00 0.00 0.00 0.00 0.00 0.00 0.00 0.00 0.00 0.00 0.00 706,080,000.00 917,423,000.00 1,075,500,000.00 1,345,600,000.00 1,732,500,000.00 2,143,600,000.00 Average at 2019 2020 2021 2022 2023 2024 2025 2026 2027 2028 2029 Terminal Year Forecasting (base) Enter your estimates in the table below: Forecast year Table 8.1 Forecasting assumptions Sales growth rate NOPAT margin Beginning networking capital to sales Beginning net long-term assets to sales Debt ratio After tax cost of debt Dividend rate % previous year 2019 2020 2021 2022 2023 2024 2025 2026 2027 2028 2029 Terminal Year Table 8.2 Forecasted financial statement Income statement ($ 000 000) Sales Net operating profit after tax Net interest expense after tax = Net income Preferred dividends Net income to common 2019 2020 2021 2022 2023 2024 2025 2026 2027 2028 2029 Terminal Year + = + Beginning balance sheet ($ 000 000) Beginning networking capital Beginning net long-term assets Net operating assets Net debt Preference shares Opening equity Equity injections needed Net capital (beginning) Profit Dividend distributions Equity issues Closing equity Net capital (closing) + + = 2019 2020 2021 2022 2023 2024 2025 2026 2027 2028 2029 Terminal Year Ratios Operating return on assets (%) Return on equity (%) Book value of assets growth (%) Book value of equity growth (%) Net operating assets turnover 2019 2020 2021 2022 2023 2024 2025 2026 2027 2028 2029 Terminal Year Ratios Operating return on assets (%) Return on equity (%) Book value of assets growth (%) Book value of equity growth (%) Net operating assets turnover 2019 2020 2021 2022 2023 2024 2025 2026 2027 2028 2029 Terminal Year - Cash flows ($ 000 000) Net Income Change in net working capital Change in net long-term assets Change in net debt Free cash flow to equity Net operating profit after tax Change in net working capital Change in net long-term assets Free cash flow to capital 09/14 09/15 09/16 09/17 09/18 09/19 Profitability Analysis Net income Shareholder's equity ROE % -16,429,000.00 706,080,000.00 -2.33 186430000.00 917423000.00 20.32 350500000.00 1075500000.00 32.59 495100000.00 1345600000.00 36.79 542600000.00 1732500000.00 31.32 698800000.00 2143600000.00 32.60 Net income Total assets Average total assets ROA% -16,429,000.00 186430000.00 1,112,709,000.00 3,218,733,000.00 3,799,307,000.00 4,336,626,600.00 -0.43 4.30 350500000.00 2,987,700,000.00 4,616,100,000.00 7.59 495100000.00 3,292,900,000.00 5,158,900,000.00 9.60 542600000.00 5,846,800,000.00 6,091,900,000.00 8.91 698800000.00 6,337,000,000.00 6,337,000,000.00 11.03 Operating management evaluation Operating sales Cost of sales EBIT 847,554,000.00 1,576,061,000.00 43896795.6 161,388,440.00 202,406,000.00 354,460,000.00 94.82 89.76 23.88 22.24 2,128,700,000.00 279,361,000.00 597,100,000.00 86.88 28.05 2,453,800,000.00 283,328,140.00 781,200,000.00 88.45 31.84 3,549,800,000.00 494,772,260.00 1,016,600,000.00 86.06 28.64 4,397,400,000.00 597,951,060.00 1,164,000,000.00 86.40 26.47 Gross profit margin % EBIT margin% Investment management evaluation Net working capital Sales 329820000 456,112,000.00 848,263,000.00 1,593,775,000.00 257.19 349.43 325,900,000.00 2,130,000,000.00 653.57 541,900,000.00 2,454,200,000.00 452.89 334,600,000.00 3,553,400,000.00 1,061.98 691,800,000.00 4,398,900,000.00 635.86 NWC to sales ratio % Sales Net accounts receivable Average accounts receivable Accounts receivable turnover 848,263,000.00 1,593,775,000.00 403701000 525,755,000.00 582,131,200.00 710,651,000.00 1.46 2.24 2,130,000,000.00 529,800,000.00 756,875,000.00 2.81 2,454,200,000.00 619,300,000.00 832,566,666.67 2.95 3,553,400,000.00 832,100,000.00 939,200,000.00 3.78 4,398,900,000.00 1,046,300,000.00 1,046,300,000.00 4.20 Financial management evaluation Current assets current liabilities Current ratio 701,497,000.00 371,677,000.00 1.89 898,473,000.00 442,361,000.00 2.03 875,100,000.00 549,200,000.00 1.59 1,195,000,000.00 653,100,000.00 1.83 1,352,100,000.00 1,017,500,000.00 1.33 1,733,200,000.00 1,041,400,000.00 1.66 Net debt Capital Net debt to capital ratio 120700000 1,972,305,000.00 826,780,000.00 2,889,728,000.00 14.60 68.25 1,629,000,000.00 2,704,500,000.00 60.23 1,400,200,000.00 2,745,800,000.00 50.99 3,686,200,000.00 5,418,700,000.00 68.03 3,624,800,000.00 5,768,400,000.00 62.84 ASX Code ALL ALL ALL ALL ALL ALL ALL ALL ALL ALL ALL ALL ALL ALL ALL ALL ALL ALL ALL ALL ALL ALL ALL ALL Company Name Aristocrat Leisure Limited Aristocrat Leisure Limited Aristocrat Leisure Limited Aristocrat Leisure Limited Aristocrat Leisure Limited Aristocrat Leisure Limited Aristocrat Leisure Limited Aristocrat Leisure Limited Aristocrat Leisure Limited Aristocrat Leisure Limited Aristocrat Leisure Limited Aristocrat Leisure Limited Aristocrat Leisure Limited Aristocrat Leisure Limited Aristocrat Leisure Limited Aristocrat Leisure Limited Aristocrat Leisure Limited Aristocrat Leisure Limited Aristocrat Leisure Limited Aristocrat Leisure Limited Aristocrat Leisure Limited Aristocrat Leisure Limited Aristocrat Leisure Limited Aristocrat Leisure Limited Item Operating Revenue Other Revenue Total Revenue Excluding Interest Operating Expenses EBITDA Depreciation Amortisation Depreciation and Amortisation EBIT Interest Revenue Interest Expense Net Interest Expense PreTax Profit Tax Expense Net Profit after Tax Before Abnormals Abnormals Abnormals Tax Net Abnormals Reported NPAT After Abnormals Outside Equity Interests Shares Outstanding at Period End Weighted Average Number of Shares EPS Adjusted (cents/share) EPS After Abnormals (cents/share) 09/14 09/15 09/16 09/17 09/18 09/19 847,554,000.00 1,576,061,000.00 2,128,700,000.00 2,453,800,000.00 3,549,800,000.00 4,397,400,000.00 709,000.00 17,714,000.00 1,300,000.00 400,000.00 3,600,000.00 1,500,000.00 848,263,000.00 1,593,775,000.00 2,130,000,000.00 2,454,200,000.00 3,553,400,000.00 4,398,900,000.00 -601,801,000.00 -1,077,931,000.00 -1,253,600,000.00 -1,389,700,000.00 -2,042,000,000.00 -2,637,000,000.00 246,462,000.00 515,844,000.00 876,400,000.00 1,064,500,000.00 1,511,400,000.00 1,761,900,000.00 -39,856,000.00 -84,142,000.00 -115,600,000.00 -111,600,000.00 -155,500,000.00 -197,100,000.00 4,200,000.00 -77,242,000.00 -163,700,000.00 -171,700,000.00 -339,300,000.00 -400,800,000.00 -44,056,000.00 -161,384,000.00 -279,300,000.00 -283,300,000.00 -494,800,000.00 -597,900,000.00 202,406,000.00 354.460,000.00 597,100,000.00 781,200,000.00 1,016,600,000.00 1,164,000,000.00 11,368,000.00 14,919,000.00 10,300,000.00 9,600,000.00 9,900,000.00 9,600,000.00 -14,043,000.00 -89,858,000.00 -100,200,000.00 -62,700,000.00 -115,300,000.00 -135,100,000.00 -2,675,000.00 -74,939,000.00 -89,900,000.00 -53,100,000.00 -105,400,000.00 -125,500,000.00 199,731,000.00 279,521,000.00 507,200,000.00 728,100,000.00 911,200,000.00 1,038,500,000.00 -36,142,000.00 -88,065,000.00 -156,700,000.00 -233,000,000.00 -250,700,000.00 -285,700,000.00 163,589,000.00 191,456,000.00 350,500,000.00 495,100,000.00 660,500,000.00 752,800,000.00 -133,100,000.00 -51,000,000.00 0.00 0.00 -148,100,000.00 -65,000,000.00 -1,400,000.00 16,200,000.00 0.00 0.00 30,200,000.00 11,000,000.00 -134,500,000.00 -34,800,000.00 0.00 0.00 -117,900,000.00 -54,000,000.00 -16,429,000.00 186,430,000.00 350,500,000.00 495,100,000.00 542,600,000.00 698,800,000.00 0.00 0.00 0.00 0.00 0.00 0.00 630,022,253.00 637,119,632.00 637,119,632.00 638,544,150.00 638,544,150.00 638,544,150.00 566,801,580.00 632,332,667.00 636,383,164.00 637,565,360.00 638,123,160.00 637,371,843.00 28.86 30.09 54.90 77.50 103.35 117.96 -2.90 29.30 54.90 77.50 84.90 109.50 ASX Code ALL ALL ALL ALL ALL ALL ALL ALL ALL ALL ALL ALL ALL ALL ALL ALL ALL ALL ALL ALL ALL ALL ALL ALL ALL ALL ALL ALL ALL ALL ALL ALL ALL ALL ALL ALL ALL JALL Company Name Aristocrat Leisure Limited Aristocrat Leisure Limited Aristocrat Leisure Limited Aristocrat Leisure Limited Aristocrat Leisure Limited Aristocrat Leisure Limited Aristocrat Leisure Limited Aristocrat Leisure Limited Aristocrat Leisure Limited Aristocrat Leisure Limited Aristocrat Leisure Limited Aristocrat Leisure Limited Aristocrat Leisure Limited Aristocrat Leisure Limited Aristocrat Leisure Limited Aristocrat Leisure Limited Aristocrat Leisure Limited Aristocrat Leisure Limited Aristocrat Leisure Limited Aristocrat Leisure Limited Aristocrat Leisure Limited Aristocrat Leisure Limited Aristocrat Leisure Limited Aristocrat Leisure Limited Aristocrat Leisure Limited Aristocrat Leisure Limited Aristocrat Leisure Limited Aristocrat Leisure Limited Aristocrat Leisure Limited Aristocrat Leisure Limited Aristocrat Leisure Limited Aristocrat Leisure Limited Aristocrat Leisure Limited Aristocrat Leisure Limited Aristocrat Leisure Limited Aristocrat Leisure Limited Aristocrat Leisure Limited Aristocrat Leisure Limited Item CA-Cash CA-Receivables CA - Prepaid Expenses CA - Inventories CA - Investments CA - NCA Held Sale CA - Other Total Current Assets NCA - Receivables NCA - Inventories NCA - Investments NCA - PP&E NCA - Intangibles(ExGW) NCA - Goodwill NCA - Future Tax Benefit NCA - Other Total NCA Total Assets CL - Account Payable CL - Short-Term Debt CL - Provisions CL - NCL Held Sale CL - Other Total Curr. Liabilities NCL - Account Payable NCL - Long-Term Debt NCL - Provisions NCL - Other Total NCL Total Liabilities Share Capital Reserves Retained Earnings Other Equity Convertible Equity SE Held Sale Outside Equity Total Equity 09/14 09/15 09/16 09/17 09/18 09/19 285,929,000.00 329,005,000.00 283,200,000.00 547,100,000.00 428,100,000.00 568,600,000.00 329,030,000.00 439,720,000.00 432,900,000.00 512,300,000.00 720,000,000.00 941,300,000.00 0.00 0.00 0.00 0.00 0.00 0.00 75,840,000.00 102,193,000.00 124,300,000.00 116,400,000.00 159,900,000.00 163,000,000.00 7,681,000.00 10,082,000.00 7,000,000.00 6,400,000.00 7,400,000.00 6,500,000.00 0.00 15,309,000.00 0.00 0.00 0.00 0.00 3,017,000.00 2.164,000.00 27,700,000.00 12,800,000.00 36,700,000.00 53,800,000.00 701,497,000.00 898,473,000.00 875,100,000.00 1,195,000,000.00 1,352,100,000.00 1,733,200,000.00 74,671,000.00 86,035,000.00 96,900,000.00 107,000,000.00 112,100,000.00 105,000,000.00 0.00 0.00 0.00 0.00 0.00 0.00 4,527,000.00 7,745,000.00 6,600,000.00 7,800,000.00 22,200,000.00 6,500,000.00 121,436,000.00 203,456,000.00 217,500,000.00 241,300,000.00 389,300,000.00 431,200,000.00 36,435,000.00 852,867,000.00 740,300,000.00 714,300,000.00 1,167,300,000.00 1,085,200,000.00 94,026,000.00 1,088,974,000.00 996,200,000.00 973,400,000.00 2,731,500,000.00 2,923,100,000.00 80,117,000.00 81,183,000.00 55,100,000.00 54,100,000.00 72,300,000.00 52,800,000.00 0.00 0.00 0.00 0.00 0.00 0.00 411,212,000.00 2,320,260,000.00 2,112,600,000.00 2,097,900,000.00 4,494,700,000.00 4,603,800,000.00 1,112,709,000.00 3,218,733,000.00 2,987,700,000.00 3,292,900,000.00 5,846,800,000.00 6,337,000,000.00 176,174,000.00 361,386,000.00 371,100,000.00 404,700,000.00 669,200,000.00 720,000,000.00 114,384,000.00 124,000.00 0.00 100,000.00 0.00 0.00 47,991,000.00 39,880,000.00 114,300,000.00 193,500,000.00 199,600,000.00 185,100,000.00 0.00 908,000.00 0.00 0.00 0.00 0.00 33,128,000.00 40,063,000.00 63,800,000.00 54,800,000.00 148,700,000.00 136,300,000.00 371,677,000.00 442,361,000.00 549,200,000.00 653,100,000.00 1,017,500,000.00 1,041,400,000.00 6,954,000.00 43,228,000.00 37,500,000.00 44,200,000.00 26,500,000.00 50,600,000.00 243,000.00 1,779,508,000.00 1,287,800,000.00 1,199,300,000.00 2,881,100,000.00 2,792,700,000.00 13,162,000.00 22,898,000.00 24,200,000.00 27,400,000.00 136,500,000.00 231,200,000.00 14,593,000.00 13,315,000.00 13,500,000.00 23,300,000.00 52,700,000.00 77,500,000.00 34,952,000.00 1,858,949,000.00 1,363,000,000.00 1,294,200,000.00 3,096,800,000.00 3,152,000,000.00 406,629,000.00 2,301,310,000.00 1,912,200,000.00 1,947,300,000.00 4,114,300,000.00 4,193,400,000.00 641,603,000.00 693,834,000.00 693,800,000.00 715,100,000.00 715,100,000.00 715,100,000.00 -58,105,000.00 15,661,000.00 -55,700,000.00 -116,800,000.00 -23,500,000.00 2,600,000.00 122,582,000.00 207,928,000.00 437,400,000.00 747,300,000.00 1,040,900,000.00 1,425,900,000.00 0.00 0.00 0.00 0.00 0.00 0.00 0.00 0.00 0.00 0.00 0.00 0.00 0.00 0.00 0.00 0.00 0.00 0.00 706,080,000.00 917,423,000.00 1,075,500,000.00 1,345,600,000.00 1,732,500,000.00 2,143,600,000.00
Step by Step Solution
There are 3 Steps involved in it

Get step-by-step solutions from verified subject matter experts