

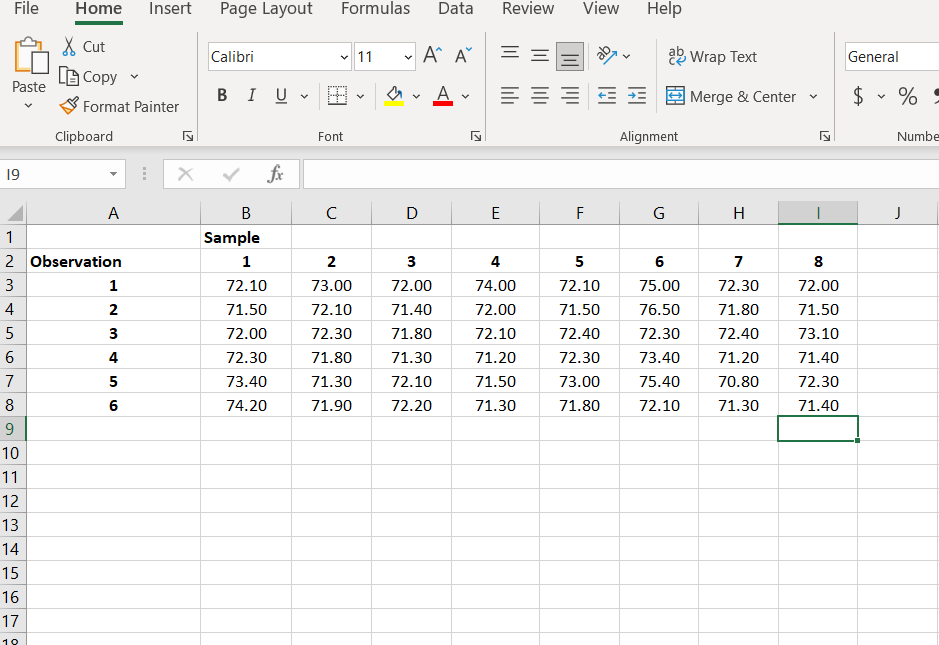
Question: Use the data in the attached Excel file to construct a mean (X-bar) control chart. The file contains values for the length of wooden boards
Use the data in the attached Excel file to construct a mean (X-bar) control chart. The file contains values for the length of wooden boards cut in a production process. Values are provided for seven samples (each with seven observations). Make sure and briefly mention whether the process appears out of control (sample mean above the UCL or below the LCL).
Step by Step Solution
There are 3 Steps involved in it
1 Expert Approved Answer
Step: 1 Unlock

Question Has Been Solved by an Expert!
Get step-by-step solutions from verified subject matter experts
Step: 2 Unlock
Step: 3 Unlock