

Question: Use the data in the Excel file for this assignment. These data represents sales (in units) of a new dessert item recently added to a
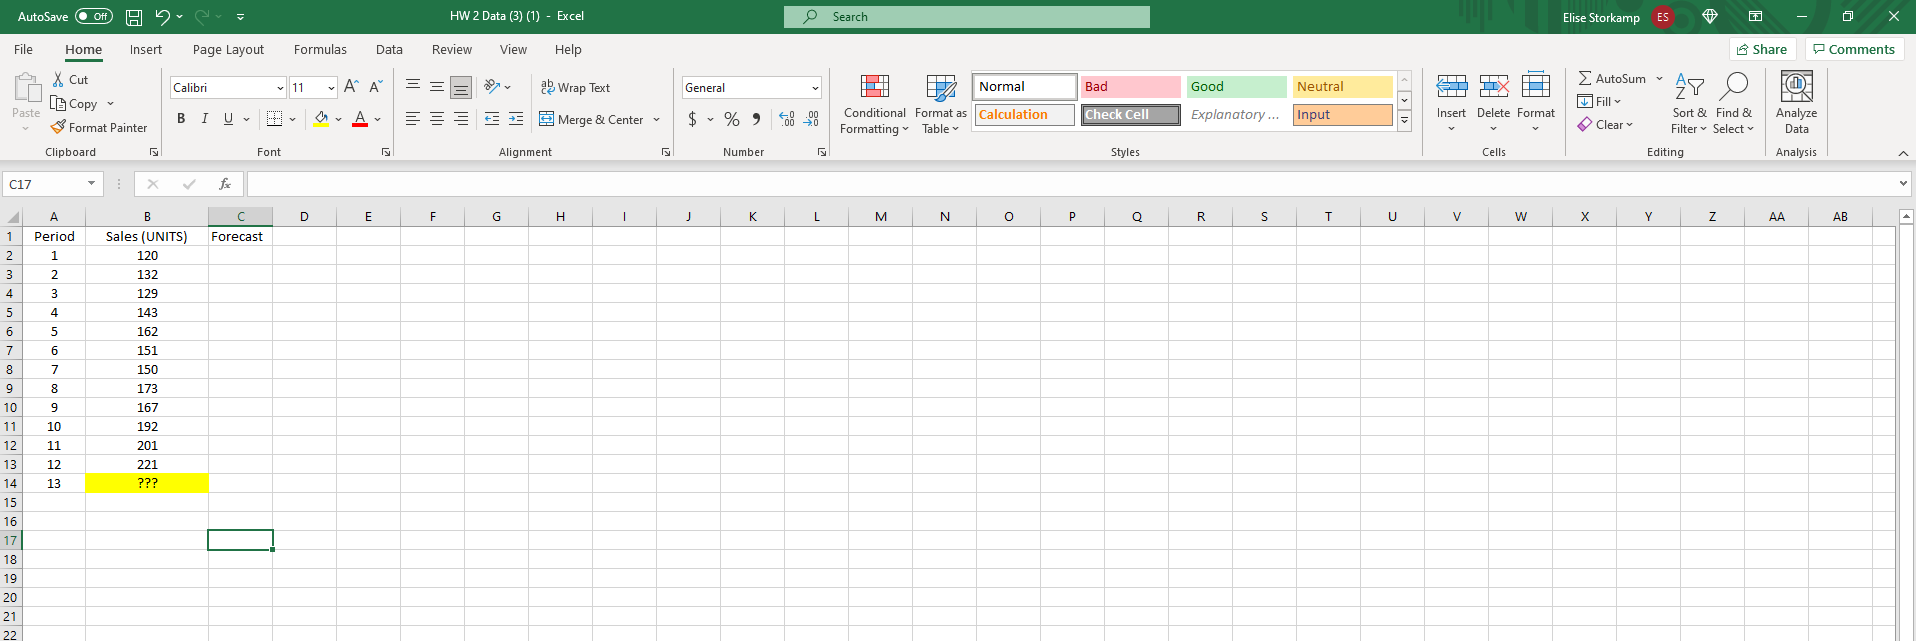
Use the data in the Excel file for this assignment. These data represents sales (in units) of a new dessert item recently added to a restaurant's menu. So far the restaurant has been selling the item for 12 weeks, and wants to forecast what sales will be in the upcoming week (week 13).
Construct both a moving average and a linear trend forecast. For the moving average forecast, average the previous five periods. For each technique, provide the forecasted values for both week 13 as well as all of the previous weeks that the technique will allow. Calculate the errors and MAD and MAPE. Based on these metrics, state which forecasting technique seems to work better for these data.
Step by Step Solution
There are 3 Steps involved in it

Get step-by-step solutions from verified subject matter experts