

Question: Use the data in the Excel workbook HW 1 Fall 19.xlxs to answer the problems below. 1.Use the monthly industry data from worksheet, Data for
Use the data in the Excel workbook HW 1 Fall 19.xlxs to answer the problems below.
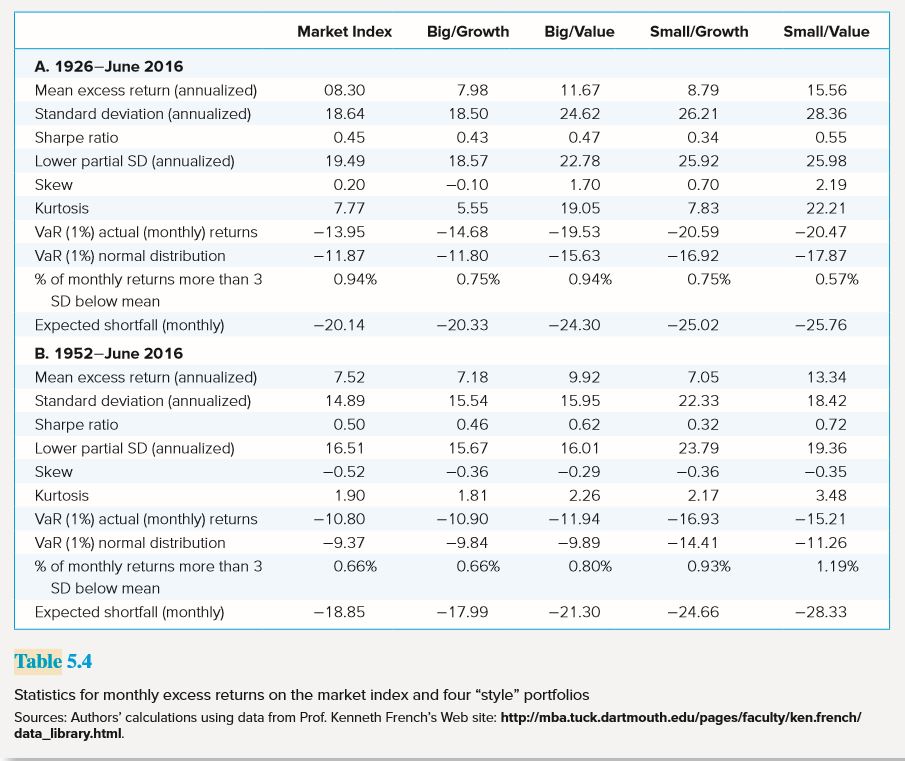
1.Use the monthly industry data from worksheet, "Data for Problem 1" to find the returns statistics reported in Table 5.4 in the textbook.
Mean excess returns (annualized)
Standard deviation (annualized)
Sharpe ratio
Lower partial SD annualized
Skew
Excess kurtosis
VaR (1%) actual (monthly) returns
VaR (1%) normal distribution
% of monthly returns more than 3 SD below mean
Expected shortfall (monthly)
Present the statistics in a nice looking table, and any notable results (e.g., highest and lowest Industry Sharpe ratios, skewness, etc.)
you can upload the excel file from this link
https://www.dropbox.com/s/j4ya2na1dj5mbga/HW%201%20Fall%2019.xlsx?dl=0
Step by Step Solution
There are 3 Steps involved in it

Get step-by-step solutions from verified subject matter experts