

Question: Use the data in the given table to create a scatter-plot. Use the scatter-plot to choose the most appropriate regression model, then fill in
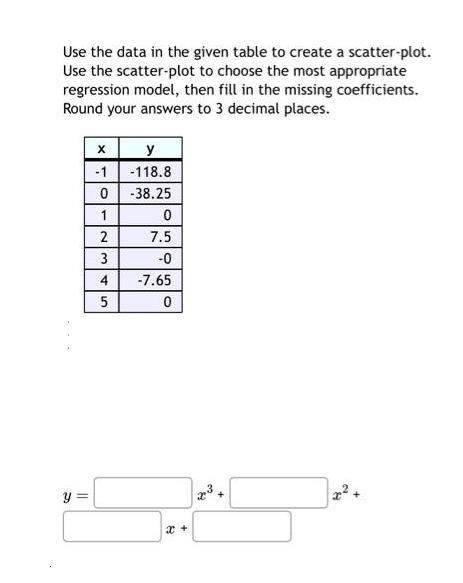
Use the data in the given table to create a scatter-plot. Use the scatter-plot to choose the most appropriate regression model, then fill in the missing coefficients. Round your answers to 3 decimal places. y = X -1 0 1 2 3 4 5 y -118.8 -38.25 0 7.5 -0 -7.65 0 x + +
Step by Step Solution
★★★★★
3.27 Rating (153 Votes )
There are 3 Steps involved in it
1 Expert Approved Answer
Step: 1 Unlock

First we create a scatter plot for the given set of data using desmos graphing calculator We enter t... View full answer
Question Has Been Solved by an Expert!
Get step-by-step solutions from verified subject matter experts
Step: 2 Unlock
Step: 3 Unlock