

Question: Use the data in the spreadsheet provided to estimate the beta of Shoe Company stock using linear regression The beta of Shoe Company stock is
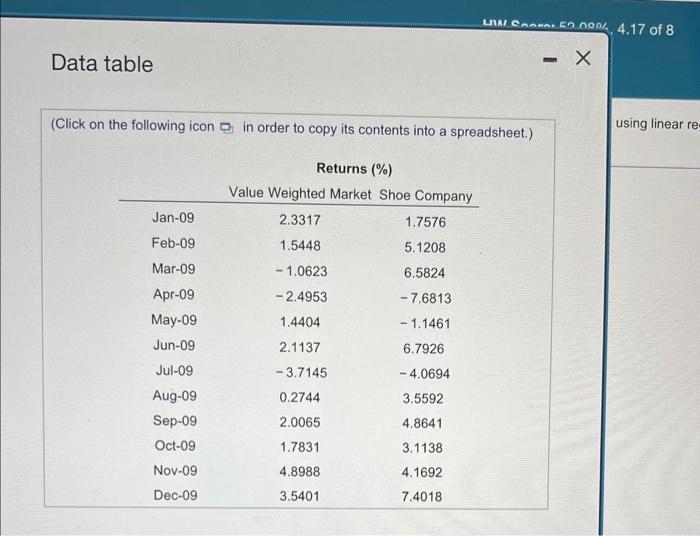
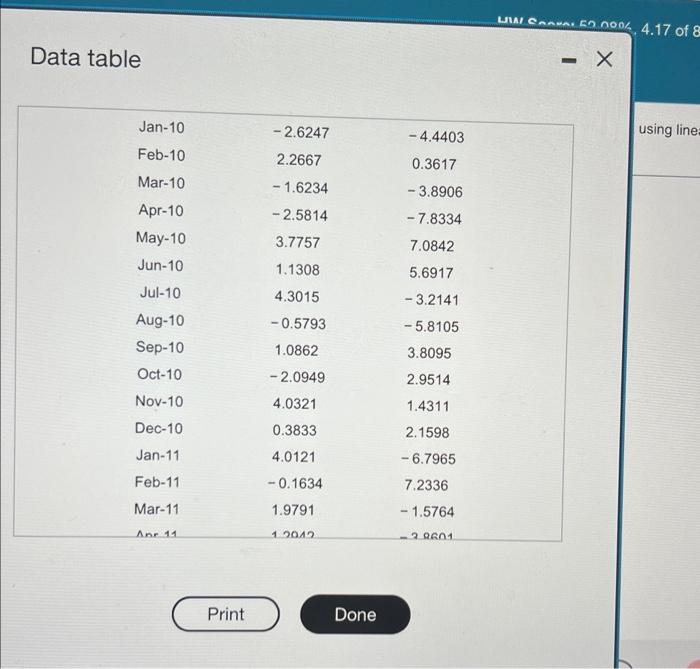
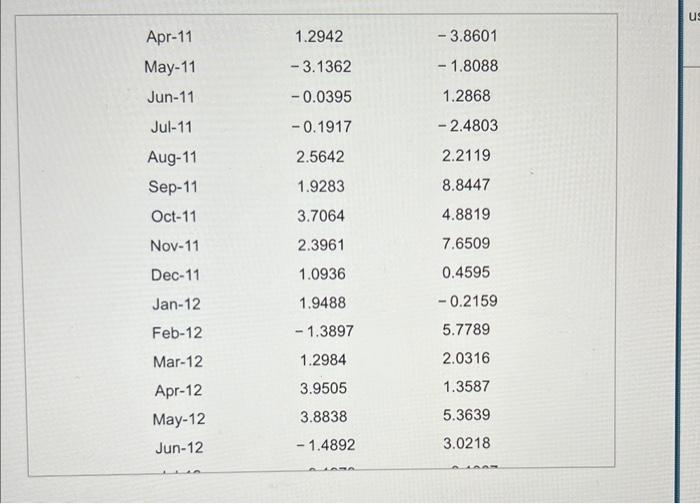
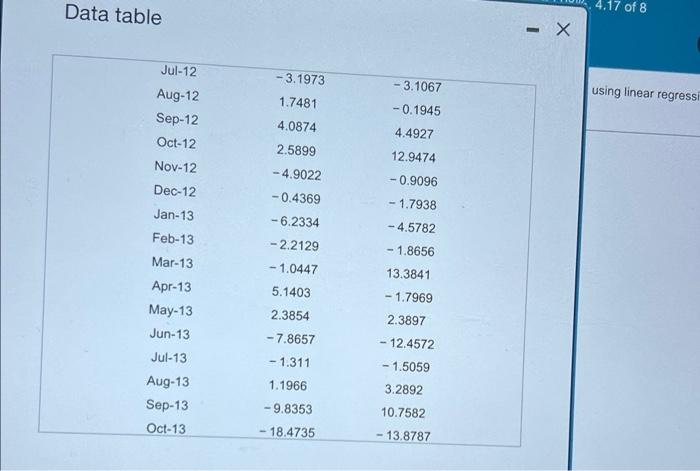
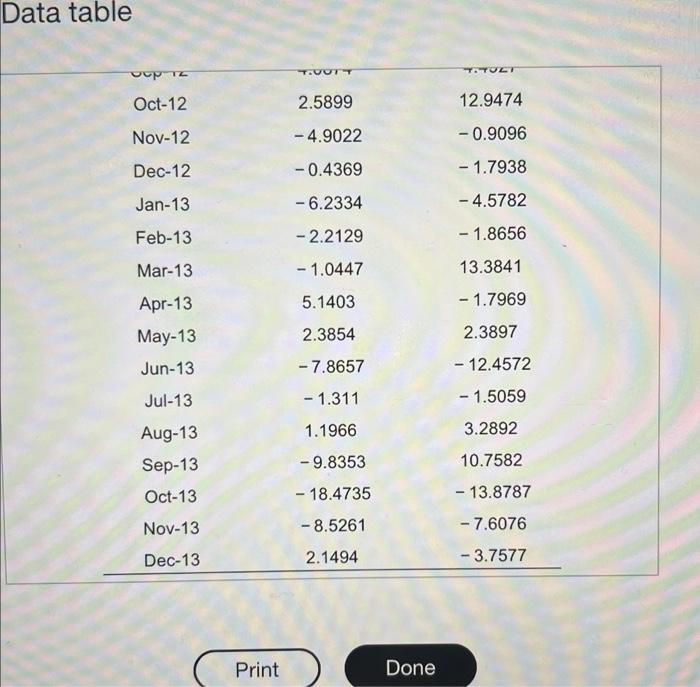
Use the data in the spreadsheet provided to estimate the beta of Shoe Company stock using linear regression The beta of Shoe Company stock is (Round to four decimal places.) Data table (Click on the following icon in order to copy its contents into a spreadsheet.) using linear re Data table \begin{tabular}{ccc} Apr-11 & 1.2942 & 3.8601 \\ May-11 & 3.1362 & 1.8088 \\ Jun-11 & 0.0395 & 1.2868 \\ Jul-11 & 0.1917 & 2.4803 \\ Aug-11 & 2.5642 & 2.2119 \\ Sep-11 & 1.9283 & 8.8447 \\ Oct-11 & 3.7064 & 4.8819 \\ Nov-11 & 2.3961 & 7.6509 \\ Dec-11 & 1.0936 & 0.4595 \\ Jan-12 & 1.9488 & 0.2159 \\ Feb-12 & 1.3897 & 5.7789 \\ Mar-12 & 1.2984 & 2.0316 \\ \hline Apr-12 & 3.9505 & 1.3587 \\ \hline May-12 & 3.8838 & 5.3639 \\ Jun-12 & 1.4892 & 3.0218 \end{tabular} Data table using linear regress Data table Use the data in the spreadsheet provided to estimate the beta of Shoe Company stock using linear regression The beta of Shoe Company stock is (Round to four decimal places.) Data table (Click on the following icon in order to copy its contents into a spreadsheet.) using linear re Data table \begin{tabular}{ccc} Apr-11 & 1.2942 & 3.8601 \\ May-11 & 3.1362 & 1.8088 \\ Jun-11 & 0.0395 & 1.2868 \\ Jul-11 & 0.1917 & 2.4803 \\ Aug-11 & 2.5642 & 2.2119 \\ Sep-11 & 1.9283 & 8.8447 \\ Oct-11 & 3.7064 & 4.8819 \\ Nov-11 & 2.3961 & 7.6509 \\ Dec-11 & 1.0936 & 0.4595 \\ Jan-12 & 1.9488 & 0.2159 \\ Feb-12 & 1.3897 & 5.7789 \\ Mar-12 & 1.2984 & 2.0316 \\ \hline Apr-12 & 3.9505 & 1.3587 \\ \hline May-12 & 3.8838 & 5.3639 \\ Jun-12 & 1.4892 & 3.0218 \end{tabular} Data table using linear regress Data table
Step by Step Solution
There are 3 Steps involved in it

Get step-by-step solutions from verified subject matter experts