

Question: Use the data in the spreadsheet provided to estimate the beta of Nike stock using linear regression. The beta of Nike stock is (Round to
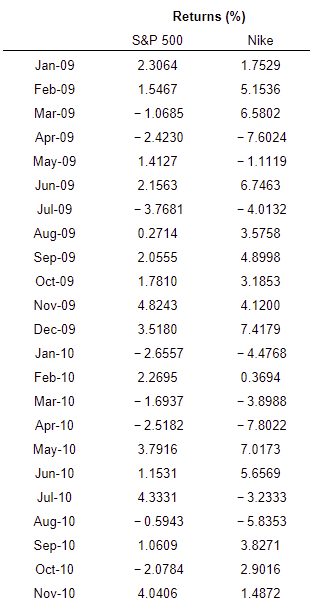
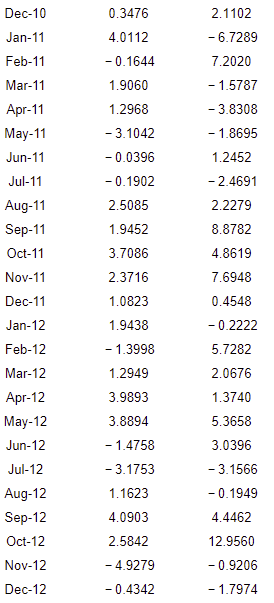
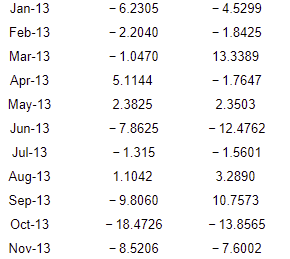
Use the data in the spreadsheet provided to estimate the beta of Nike stock using linear regression. The beta of Nike stock is (Round to four decimal places.) Returns (%) S&P 500 Nike 2.3064 1.7529 1.5467 5.1536 - 1.0685 6.5802 - 7.6024 -2.4230 1.4127 - 1.1119 6.7463 2.1563 Jan-09 Feb-09 Mar-09 Apr-09 May-09 Jun-09 Jul-09 Aug-09 Sep-09 Oct-09 Nov-09 Dec-09 Jan-10 Feb-10 Mar-10 Apr-10 May-10 Jun-10 Jul-10 Aug-10 Sep-10 Oct-10 - 3.7681 0.2714 2.0555 1.7810 4.8243 3.5180 -2.6557 2.2695 - 1.6937 -4.0132 3.5758 4.8998 3.1853 4.1200 7.4179 - 4.4768 0.3694 - 3.8988 - 7.8022 - 2.5182 3.7916 1.1531 4.3331 -0.5943 1.0609 - 2.0784 4.0406 7.0173 5.6569 -3.2333 -5.8353 3.8271 2.9016 1.4872 Nov-10 Dec-10 Jan-11 Feb-11 Mar-11 2.1102 -6.7289 7.2020 - 1.5787 -3.8308 - 1.8695 1.2452 Apr-11 May-11 Jun-11 Jul-11 0.3476 4.0112 -0.1644 1.9060 1.2968 - 3.1042 -0.0396 -0.1902 2.5085 1.9452 3.7086 2.3716 1.0823 1.9438 - 1.3998 1.2949 3.9893 -2.4691 2.2279 8.8782 Aug-11 Sep-11 Oct-11 Nov-11 Dec-11 Jan-12 Feb-12 Mar-12 Apr-12 May-12 Jun-12 Jul-12 Aug-12 Sep-12 Oct-12 Nov-12 Dec-12 4.8619 7.6948 0.4548 -0.2222 5.7282 2.0676 1.3740 5.3658 3.0396 3.8894 -1.4758 -3.1753 1.1623 4.0903 -3.1566 -0.1949 4.4462 12.9560 2.5842 -4.9279 -0.9206 - 1.7974 -0.4342 Jan-13 Feb-13 Mar-13 Apr-13 May-13 Jun-13 Jul-13 Aug-13 Sep-13 Oct-13 Nov-13 - 6.2305 - 2.2040 - 1.0470 5.1144 2.3825 - 7.8625 - 1.315 1.1042 - 9.8060 - 18.4726 -8.5206 -4.5299 - 1.8425 13.3389 - 1.7647 2.3503 - 12.4762 -1.5601 3.2890 10.7573 - 13.8565 - 7.6002
Step by Step Solution
There are 3 Steps involved in it

Get step-by-step solutions from verified subject matter experts