

Question: Use the data in the table below to answer the following questions. fPlot the points AHE on the graph. Instructions: Click the 3-point shader tool
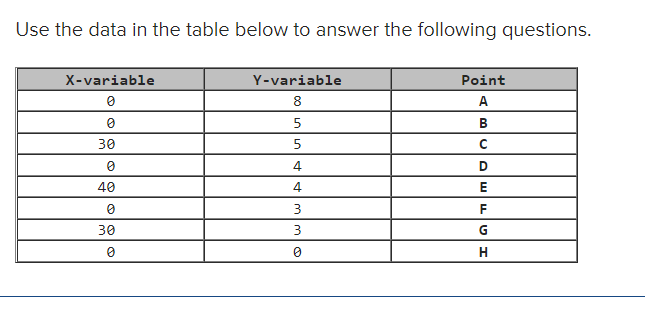

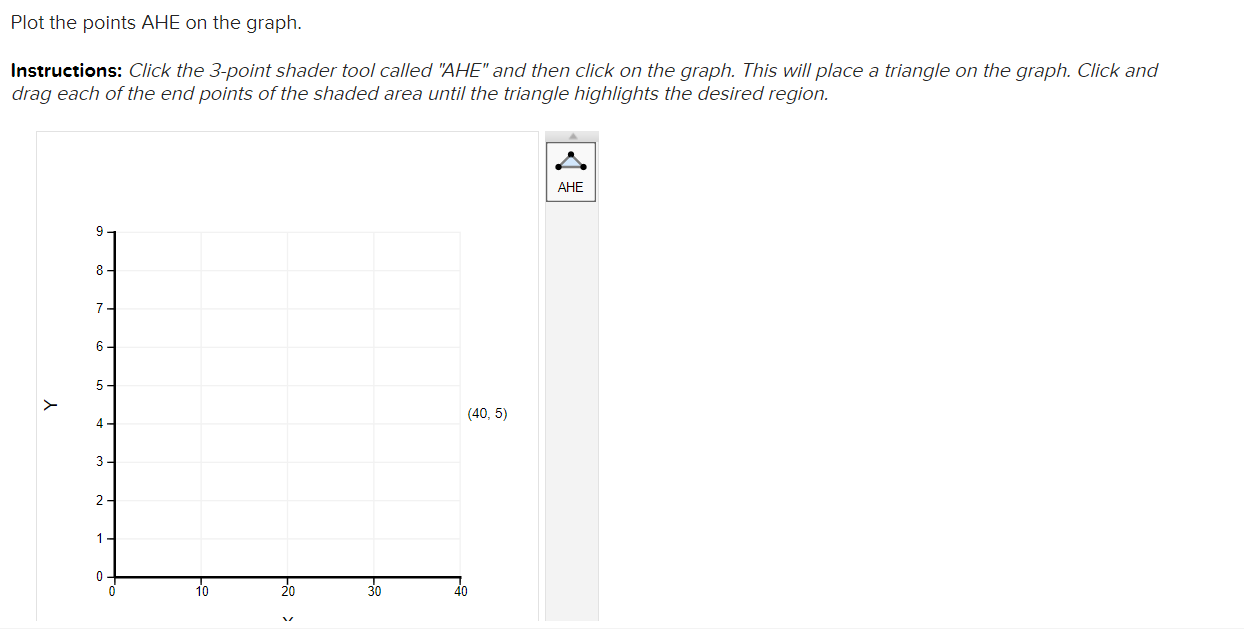
Use the data in the table below to answer the following questions. \fPlot the points AHE on the graph. Instructions: Click the 3-point shader tool called "AHE" and then click on the graph. This will place a triangle on the graph. Click and drag each of the end points of the shaded area until the triangle highlights the desired region. AHE 9 7 - 6 - 5 (40, 5) 3 2- 10 20 30 40
Step by Step Solution
There are 3 Steps involved in it
1 Expert Approved Answer
Step: 1 Unlock

Question Has Been Solved by an Expert!
Get step-by-step solutions from verified subject matter experts
Step: 2 Unlock
Step: 3 Unlock