

Question: Use the data provided in the left - most table to complete the worksheet, filling in each of the blue - shaded cells with a
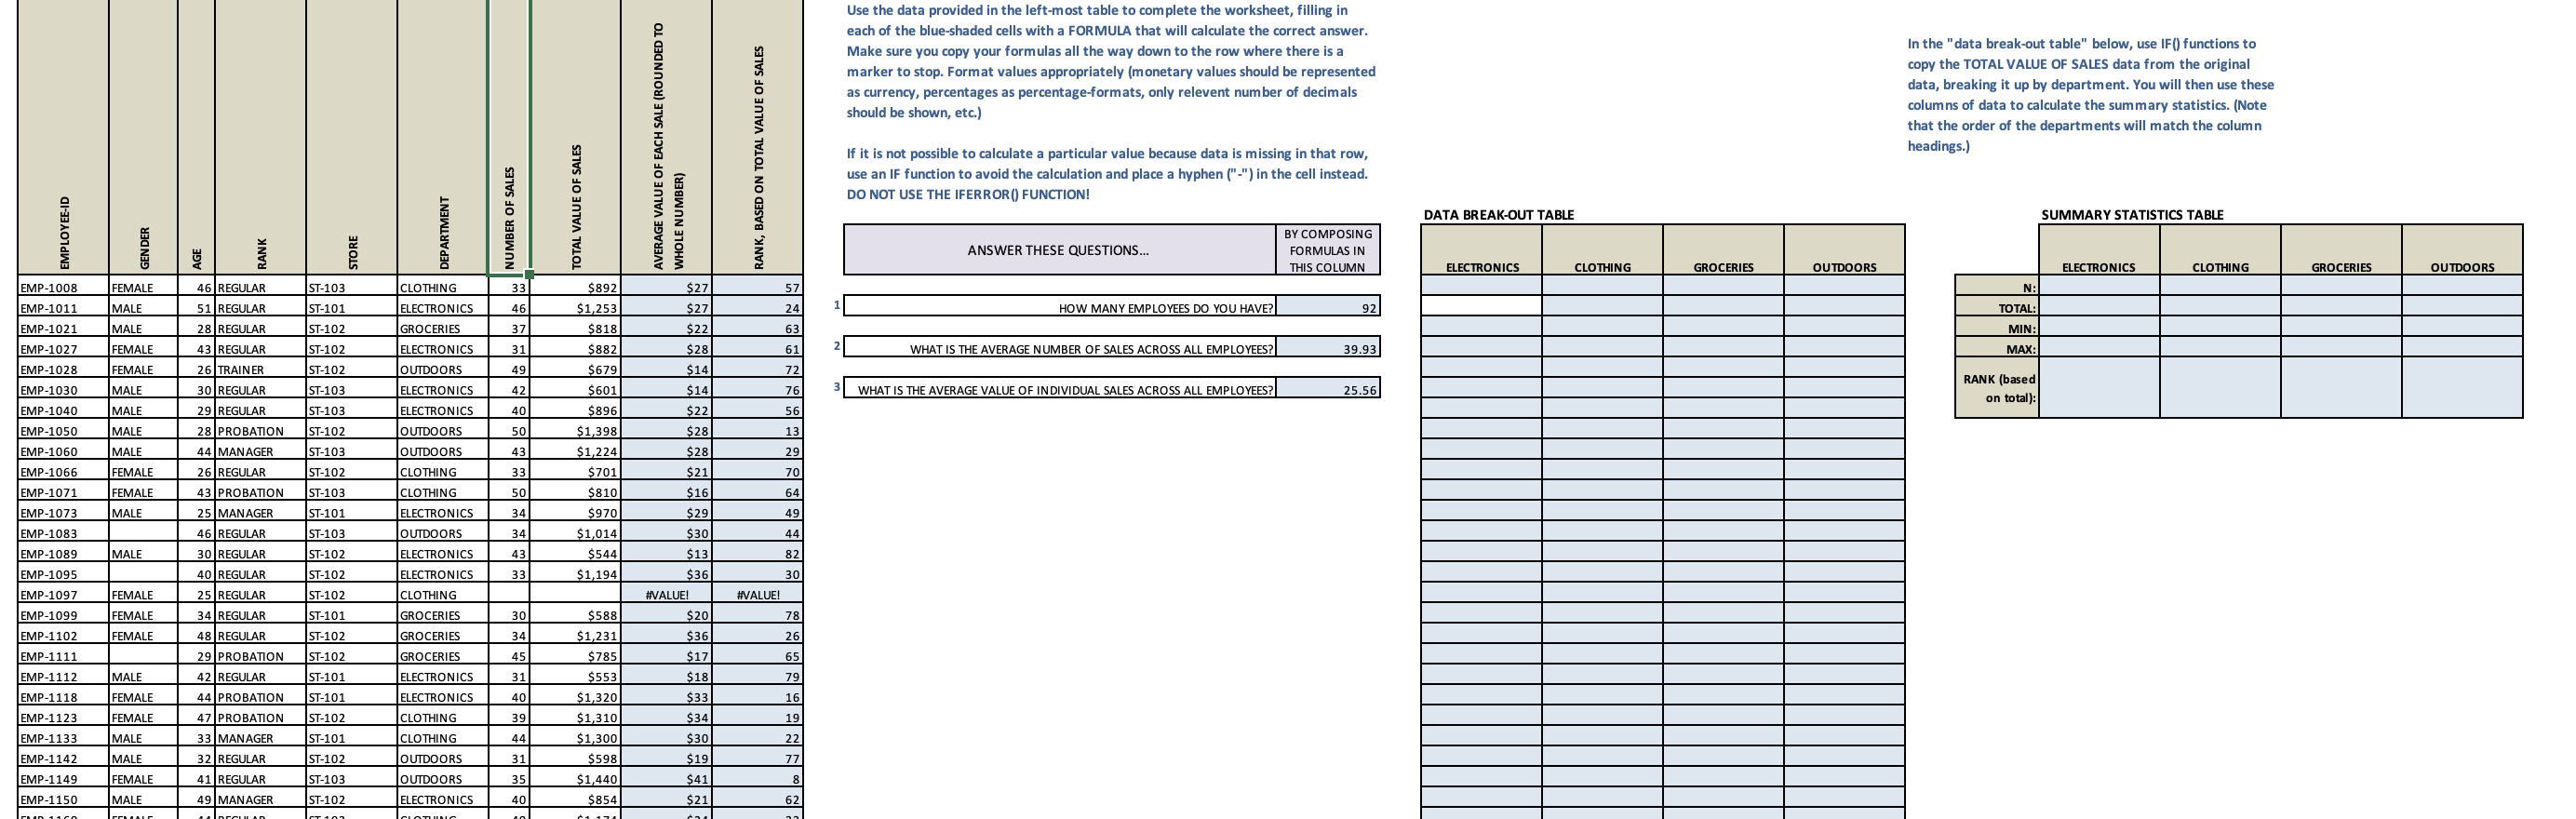
Use the data provided in the leftmost table to complete the worksheet, filling in
each of the blueshaded cells with a FORMULA that will calculate the correct answer
Make sure you copy your formulas all the way down to the row where there is a
marker to stop. Format values appropriately monetary values should be represented
currency, percentages as percentageformats, only relevent number of decimals
should be shown, etc.
If it is not possible to calculate a particular value because data is missing in that row,
use an IF function to avoid the calculation and place a hyphen in the cell instead.
DO NOT USE THE IFERROR FUNCTION!
In the "data breakout table" below, use IF functions to
copy the TOTAL VALUE OF SALES data from the original
data, breaking it up by department. You will then use thes
columns of data to calculate the summary statistics. Note
that the order of the departments will match the column
heading.
SUMMARY STATISTICS TABLE mainly just the two blank tables i need formulas for, the departments change each time so electronics can be the first column or something else and it changes every time i click on and off it if you have any inout of the other tables too
Step by Step Solution
There are 3 Steps involved in it
1 Expert Approved Answer
Step: 1 Unlock

Question Has Been Solved by an Expert!
Get step-by-step solutions from verified subject matter experts
Step: 2 Unlock
Step: 3 Unlock