

Question: Use the data provided to plot the standard grading envelop for coarse aggregates and also plot the graph of cumulative percent passing against the seive
Use the data provided to plot the standard grading envelop for coarse aggregates and also plot the graph of cumulative percent passing against the seive sizes for the sample of coarse aggregates. plot 2 diiferent graphs.
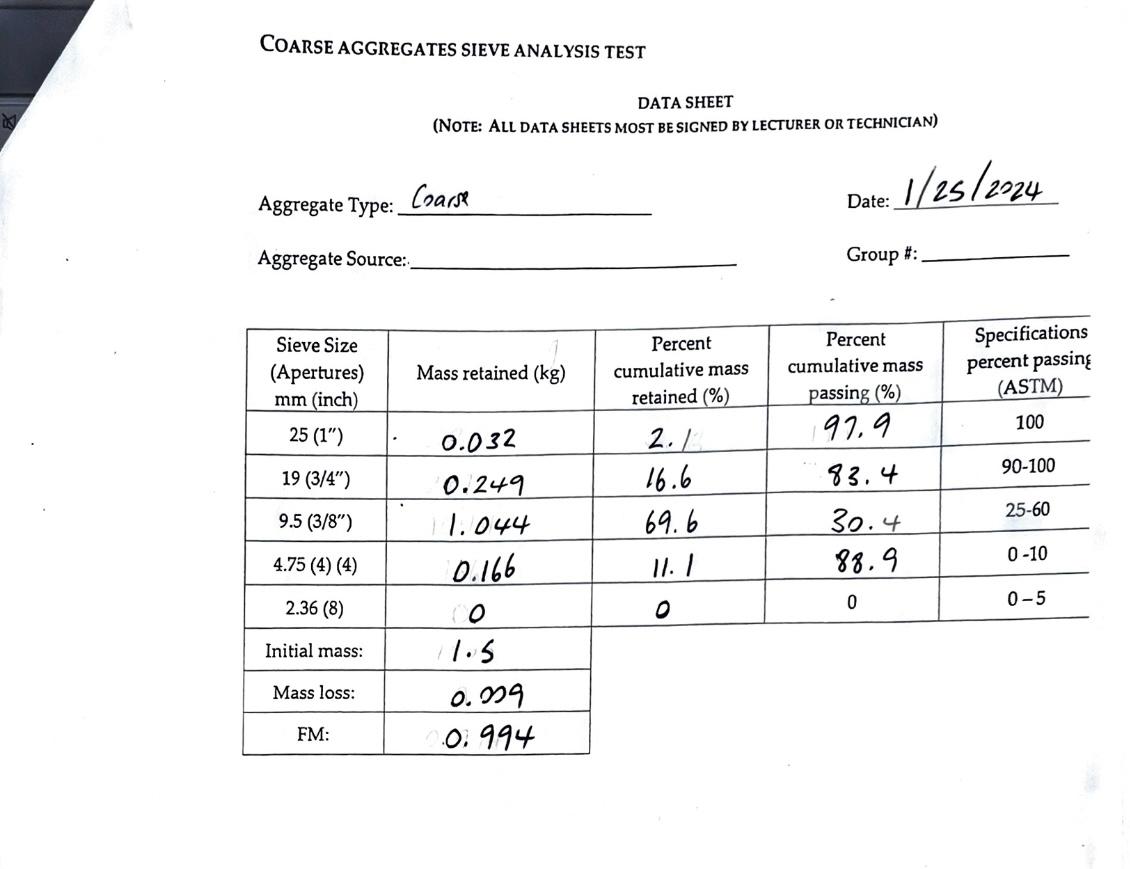
COARSE AGGREGATES SIEVE ANALYSIS TEST DATA SHEET (NOTE: ALL DATA SHEETS MOST BE SIGNED BY LECTURER OR TECHNICIAN) Aggregate Type:. Coarse Aggregate Source: Date: 1/25/2024 Group #: Sieve Size (Apertures) Mass retained (kg) Percent cumulative mass Percent cumulative mass Specifications percent passing mm (inch) retained (%) passing (%) (ASTM) 25 (1") 0.032 2.1 197.9 100 19 (3/4") 0.249 16.6 83.4 90-100 9.5 (3/8") 11.044 69.6 30.4 25-60 4.75 (4) (4) 0.166 11.1 88.9 0-10 2.36 (8) 00 0 0 0-5 Initial mass: 1.5 Mass loss: FM: 0.009 0.994
Step by Step Solution
There are 3 Steps involved in it

Get step-by-step solutions from verified subject matter experts