

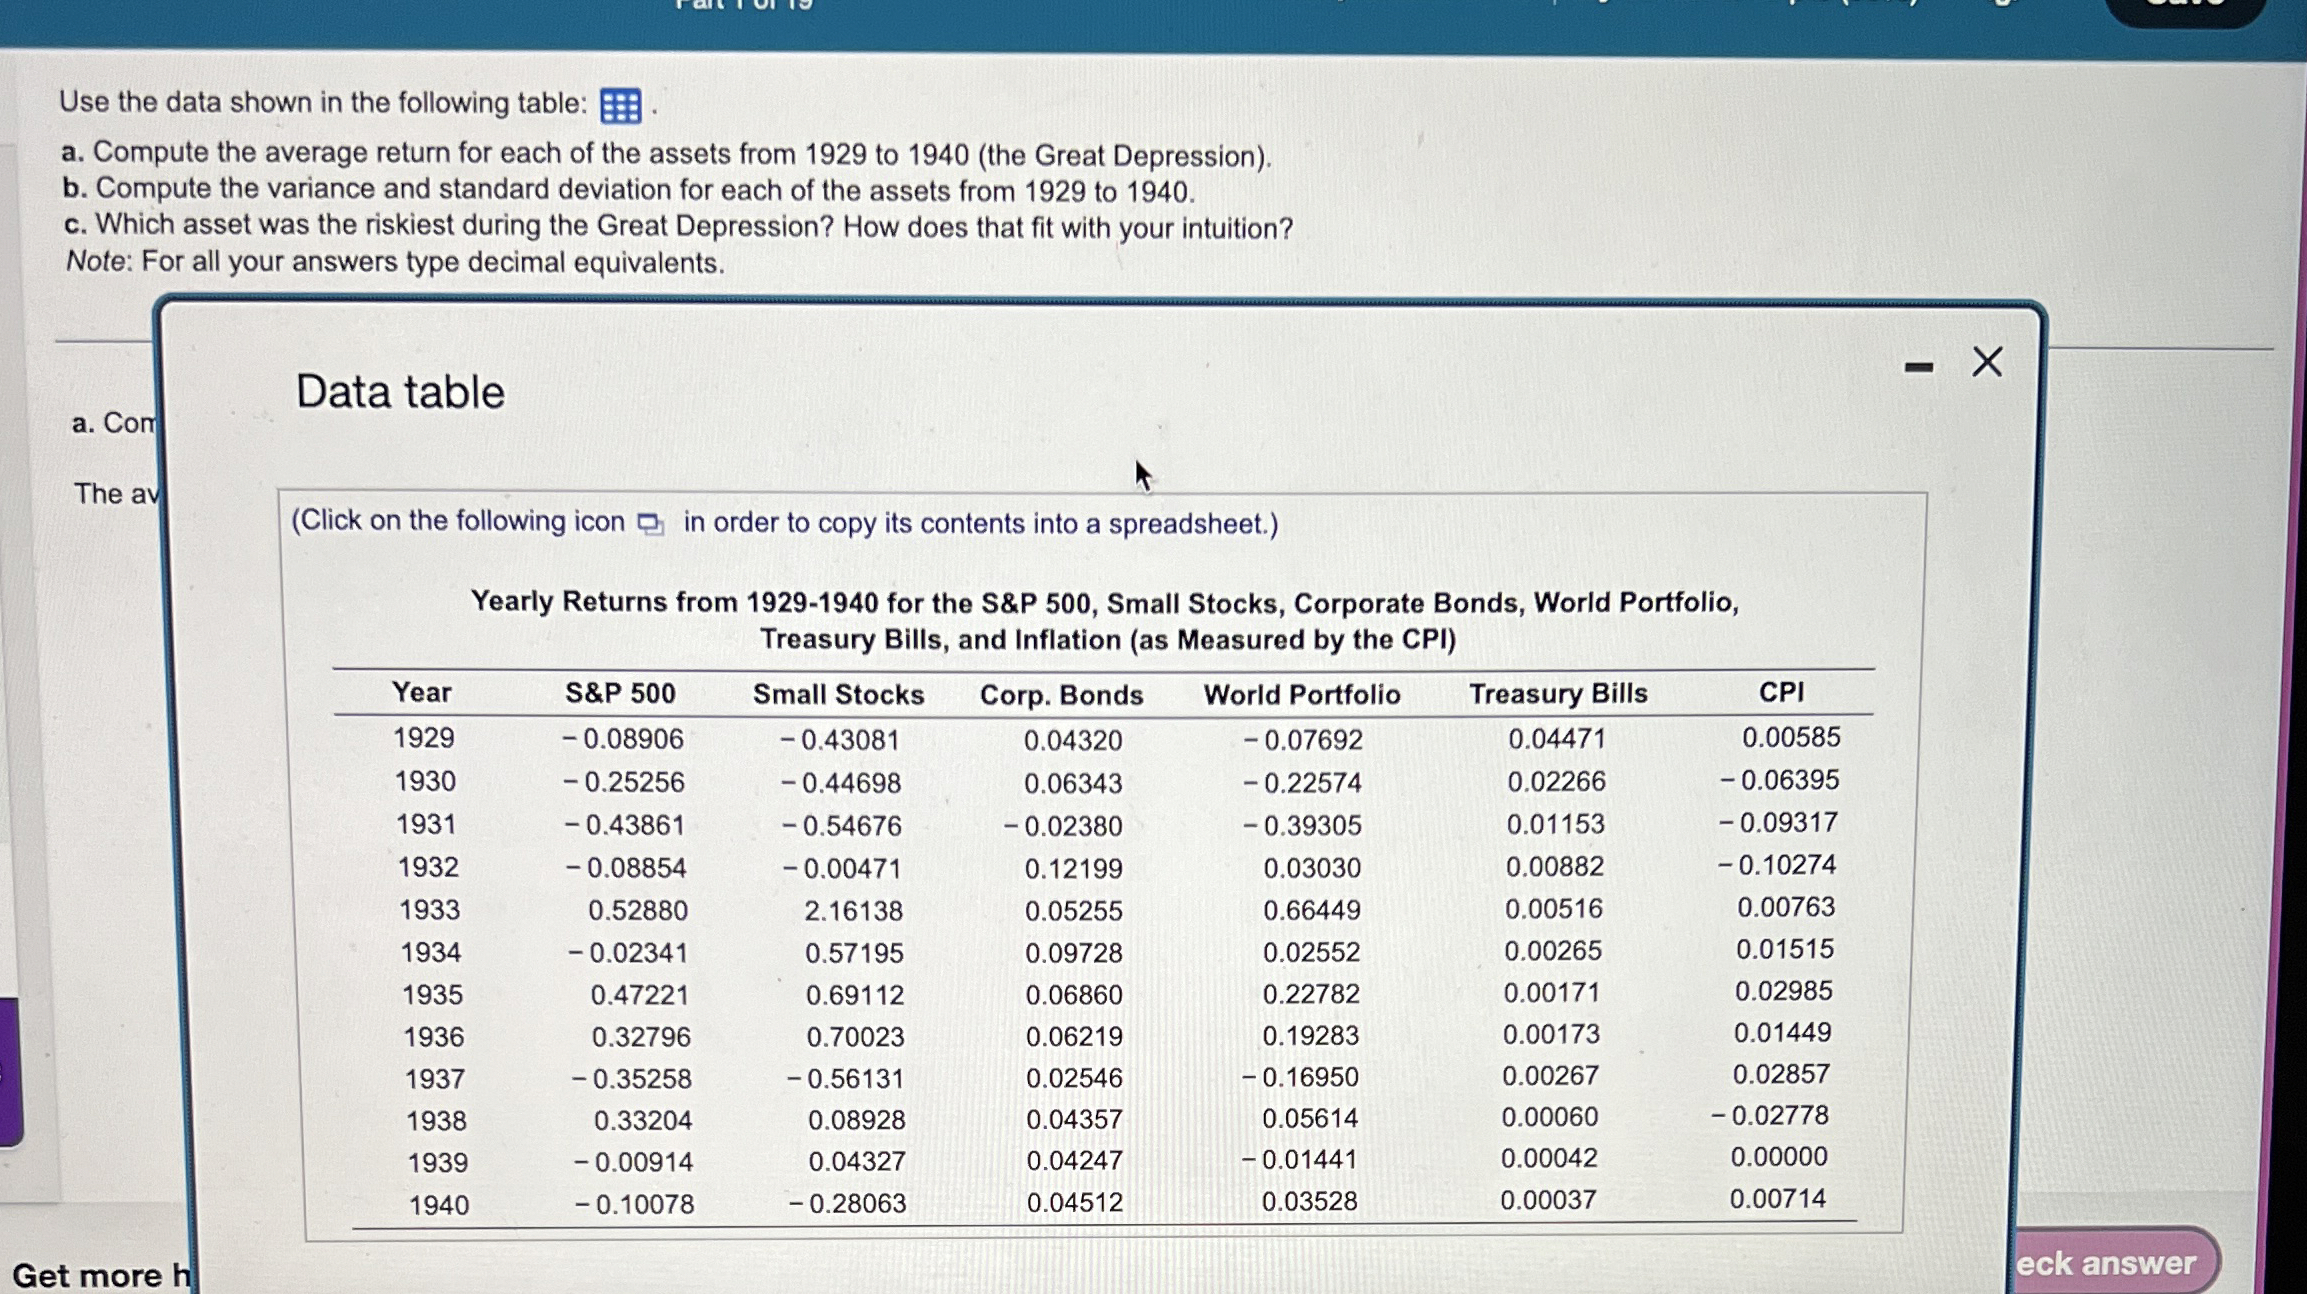
Question: Use the data shown in the following table: a . Compute the average return for each of the assets from 1 9 2 9 to
Use the data shown in the following table:
a Compute the average return for each of the assets from to the Great Depression
b Compute the variance and standard deviation for each of the assets from to
c Which asset was the riskiest during the Great Depression? How does that fit with your intuition?
Note: For all your answers type decimal equivalents.
a Con
The av
Data table
Click on the following icon in order to copy its contents into a spreadsheet.
Yearly Returns from for the S&P Small Stocks, Corporate Bonds, World Portfolio, Treasury Bills, and Inflation as Measured by the CPI
tableYearS&P Small Stocks,Corp. Bonds,World Portfolio,Treasury Bills,CPI
Get more h
Step by Step Solution
There are 3 Steps involved in it
1 Expert Approved Answer
Step: 1 Unlock

Question Has Been Solved by an Expert!
Get step-by-step solutions from verified subject matter experts
Step: 2 Unlock
Step: 3 Unlock