

Question: Use the data to construct a model that predicts the tax assessment value assigned to medical office buildings with specific characteristics. Construct a scatter plot
Use the data to construct a model that predicts the tax assessment value assigned to medical office buildings with specific characteristics.
- Construct a scatter plot in Excel with FloorArea as the independent variable and AssessmentValue as the dependent variable. Insert the bivariate linear regression equation and r^2 in your graph. Do you observe a linear relationship between the 2 variables?
- Use Excel's Analysis ToolPak to conduct a regression analysis of FloorArea and AssessmentValue. Is FloorArea a significant predictor of AssessmentValue?
- Construct a scatter plot in Excel with Age as the independent variable and AssessmentValue as the dependent variable. Insert the bivariate linear regression equation and r^2 in your graph. Do you observe a linear relationship between the 2 variables?
- Use Excel's Analysis ToolPak to conduct a regression analysis of Age and Assessment Value. Is Age a significant predictor of AssessmentValue?
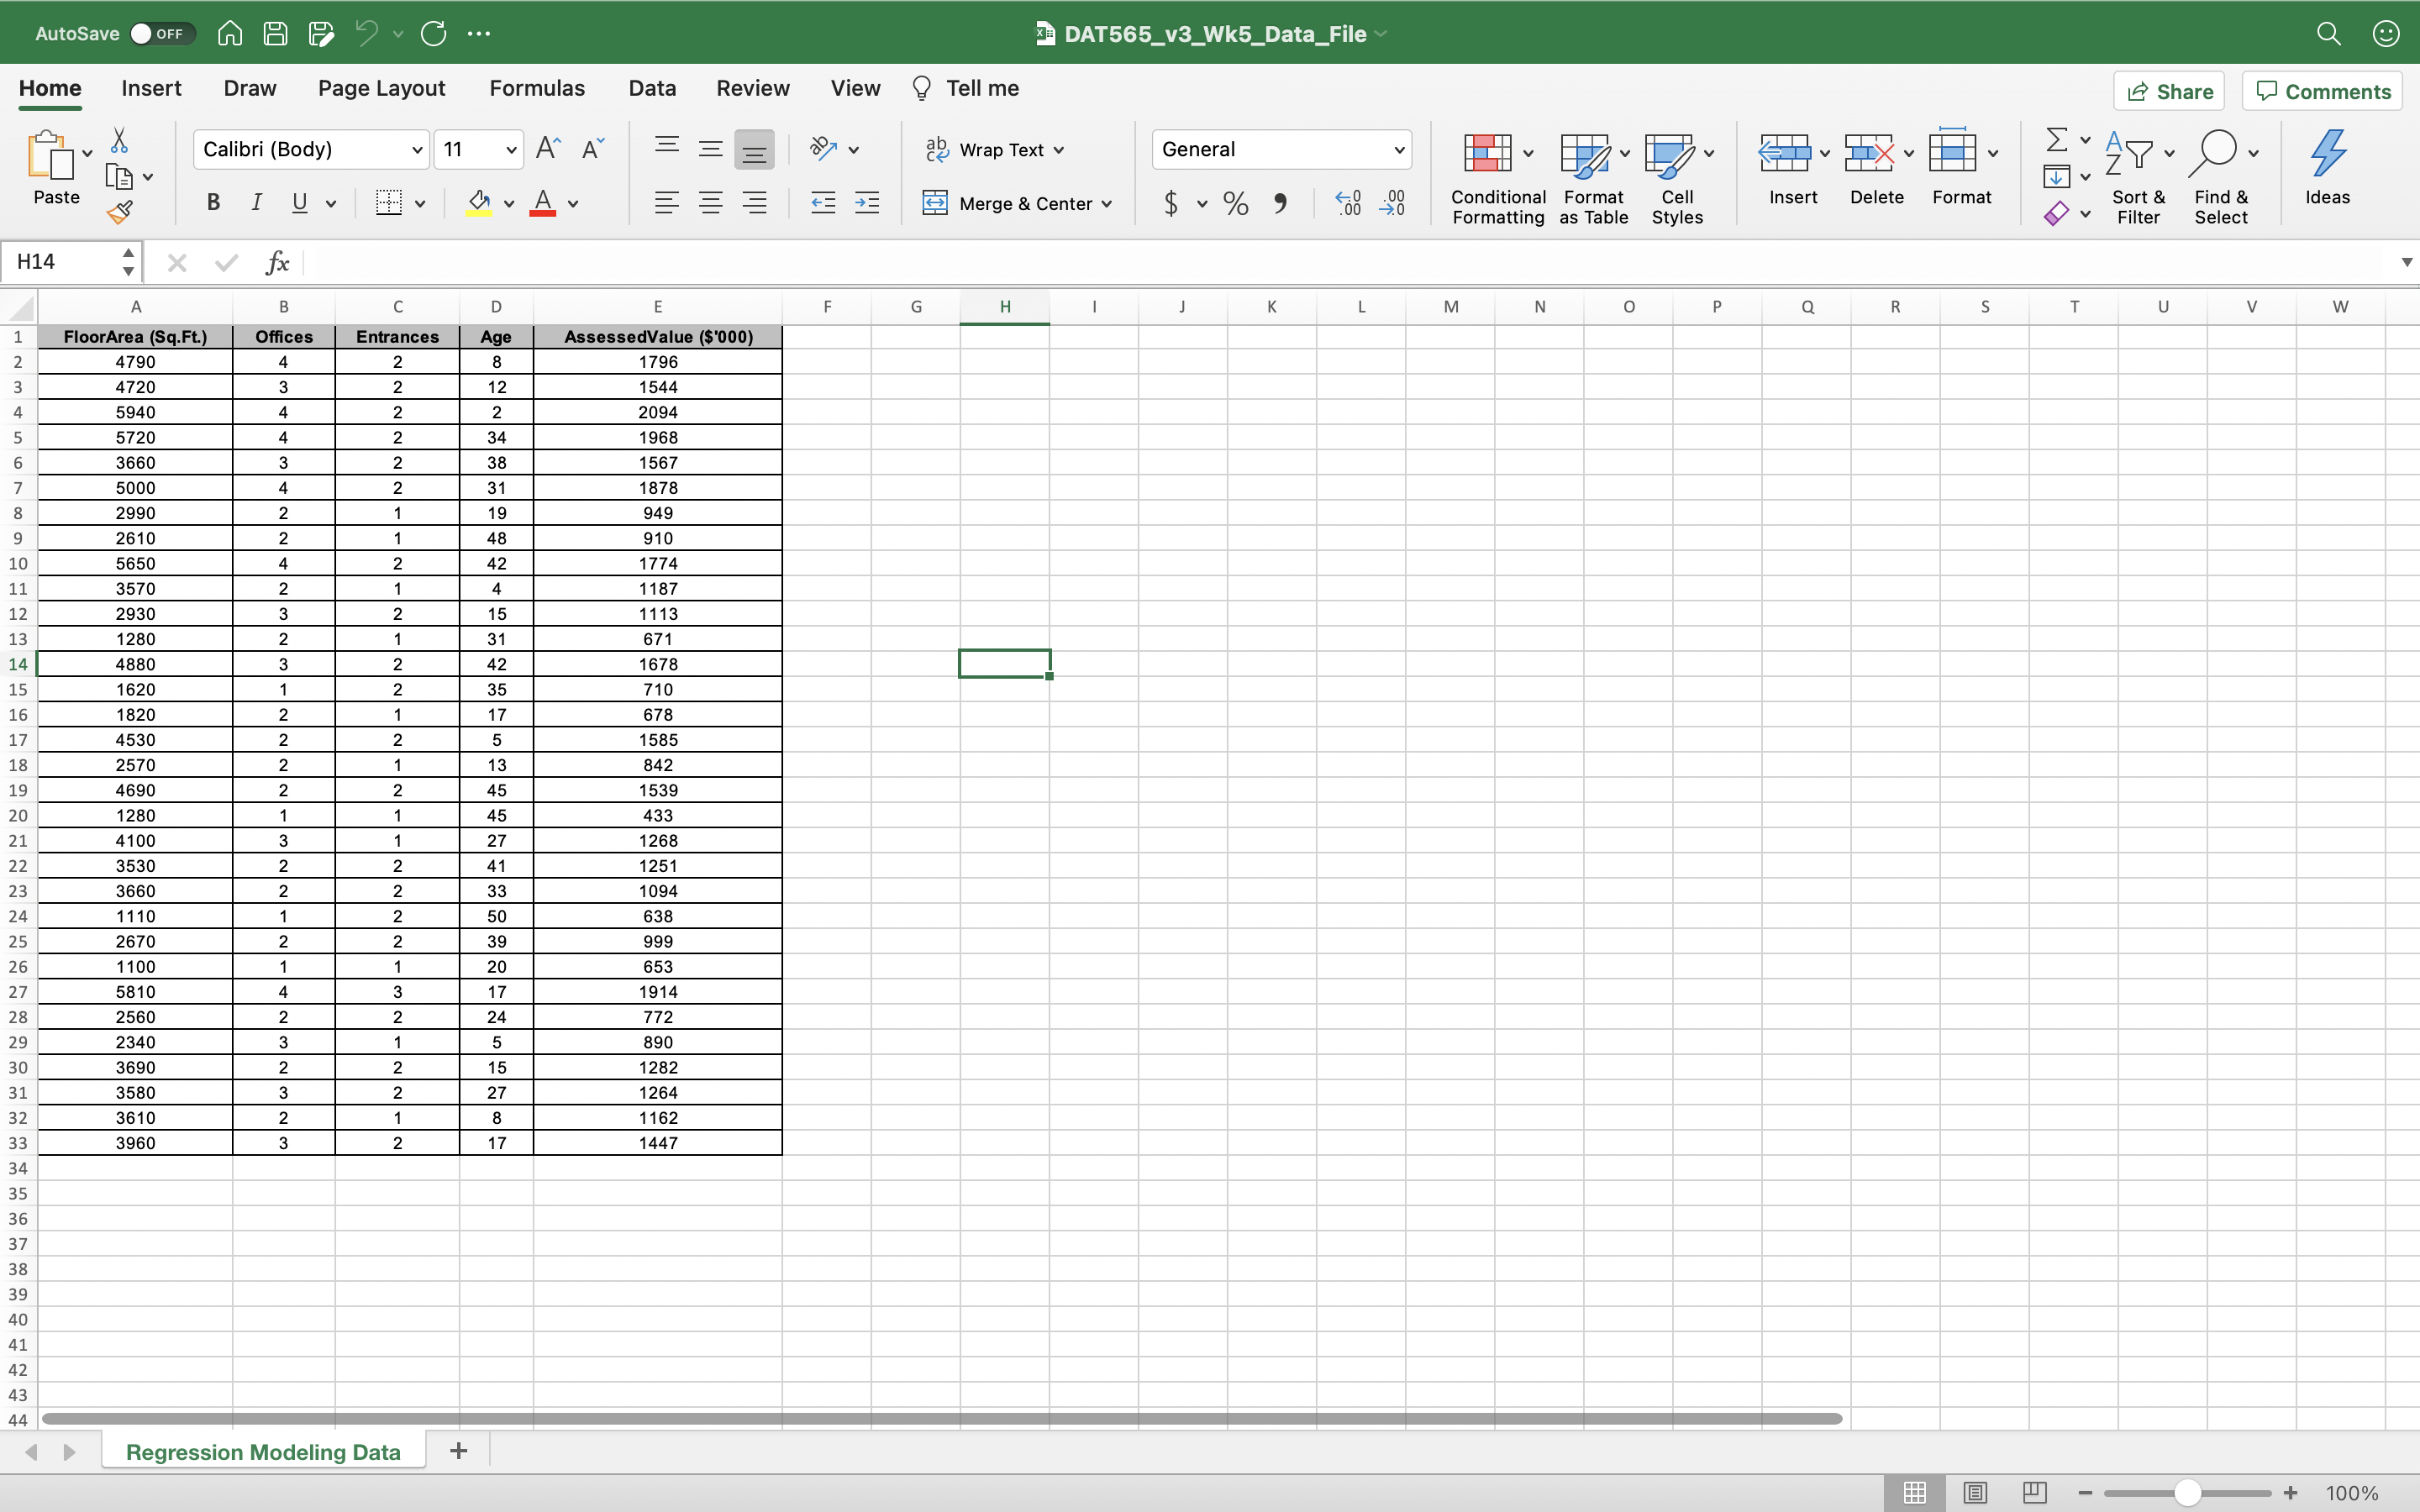
AutoSave OFF MA F C... DAT565_v3_Wk5_Data_File Page Layout Formulas Data Review View Tell me Share Comments Home Insert Draw Calibri (Body) v 11 AA = ab Wrap Text General 4 $ ~ % " Conditional Format Cell Insert Delete Format Sort & Find & Ideas Paste BIUV DVAv E Merge & Center v Formatting as Table Styles Filter Select H14 X V fx M N 0 P Q R S T U V W A B D G H 1 K L FloorArea (Sq.Ft.) Offices Entrances Age AssessedValue ($'000) 4790 2 8 1796 4720 2 12 1544 Un AWNI 594 2 2 2094 5720 2 34 1968 3660 2 38 1567 5000 2 31 1878 10 00 2990 19 949 2610 910 5650 2 1774 3570 1187 2930 1113 1280 UN - N - 671 488 1678 1620 710 1820 678 4530 1585 2570 842 4690 1539 W N W N W N A - N - N N W - N N N N - W N W N A N N A W A 1280 433 4100 1268 3530 1251 3660 1094 111 638 IN N - N W - N N N N - - N - 2670 999 1100 653 58 10 1914 2560 772 234 890 3690 1282 3580 1264 3610 1162 3960 1447 35 36 37 38 39 40 41 42 43 44 Regression Modeling Data + + 100%
Step by Step Solution
There are 3 Steps involved in it

Get step-by-step solutions from verified subject matter experts