

Question: Use the Data to Construct the Confidence Interval 5.Using the given information, construct a confidence interval for each confidence level given. Confidence Level EBM /

Use the Data to Construct the Confidence Interval
5.Using the given information, construct a confidence interval for each confidence level given.
| Confidence Level | EBM / Error Bound | Confidence Interval |
| 50% | ||
| 80% | ||
| 95% | ||
| 99% |
6. Some students think that a 90% confidence interval contains 90% of the data. Use the list of data on the first page and count how many of the data values lie within the confidence interval. What percent is this? Is this percent close to 90%? Explain why this percent should or should not be close to 90%.
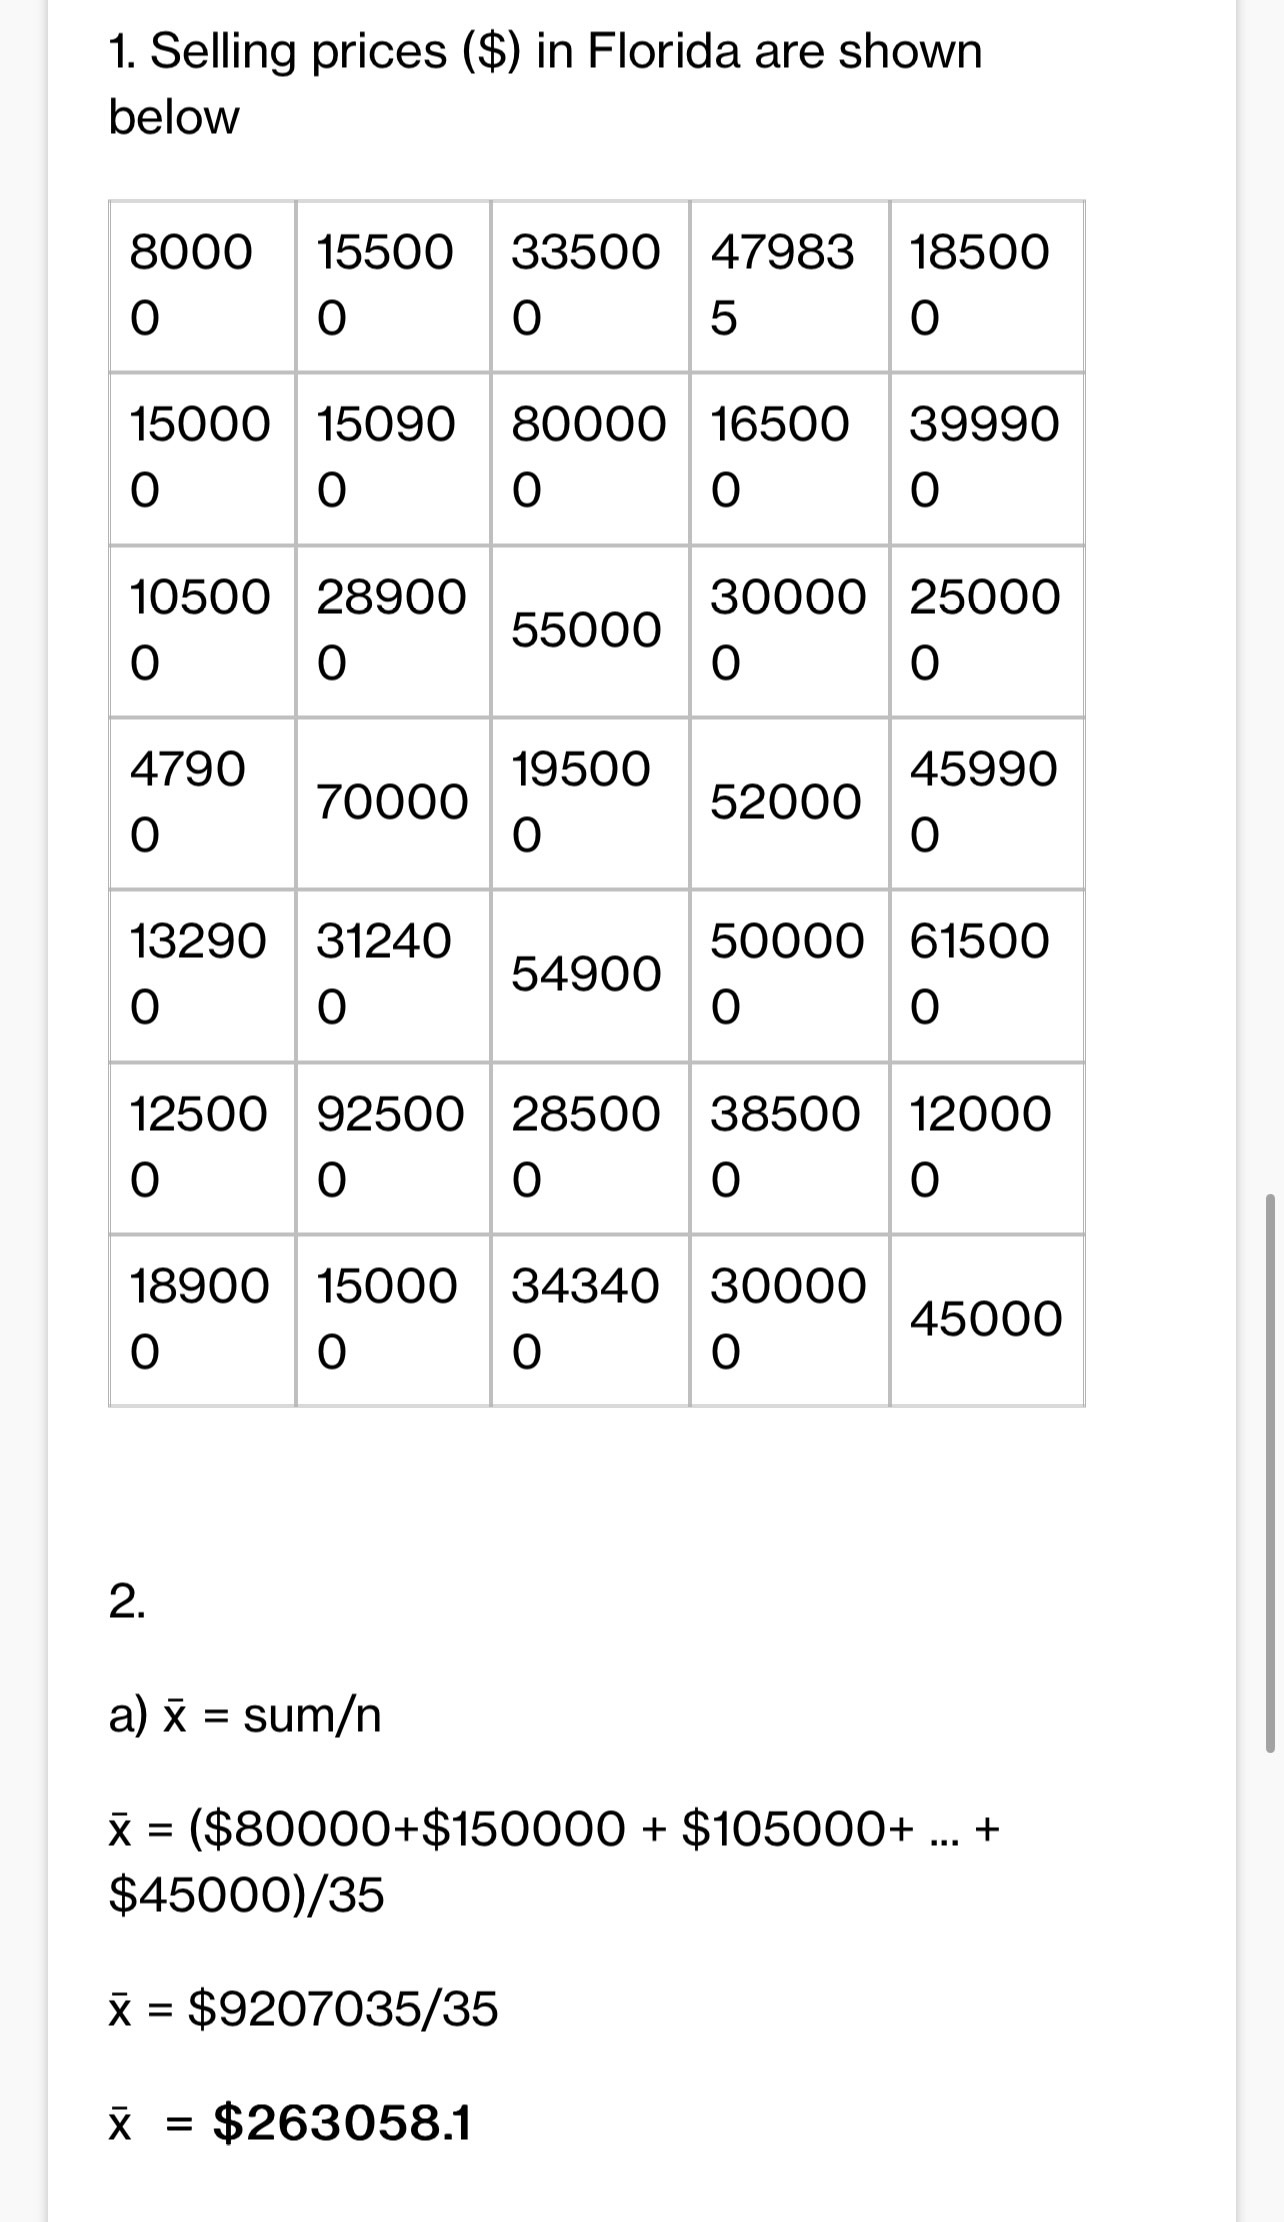

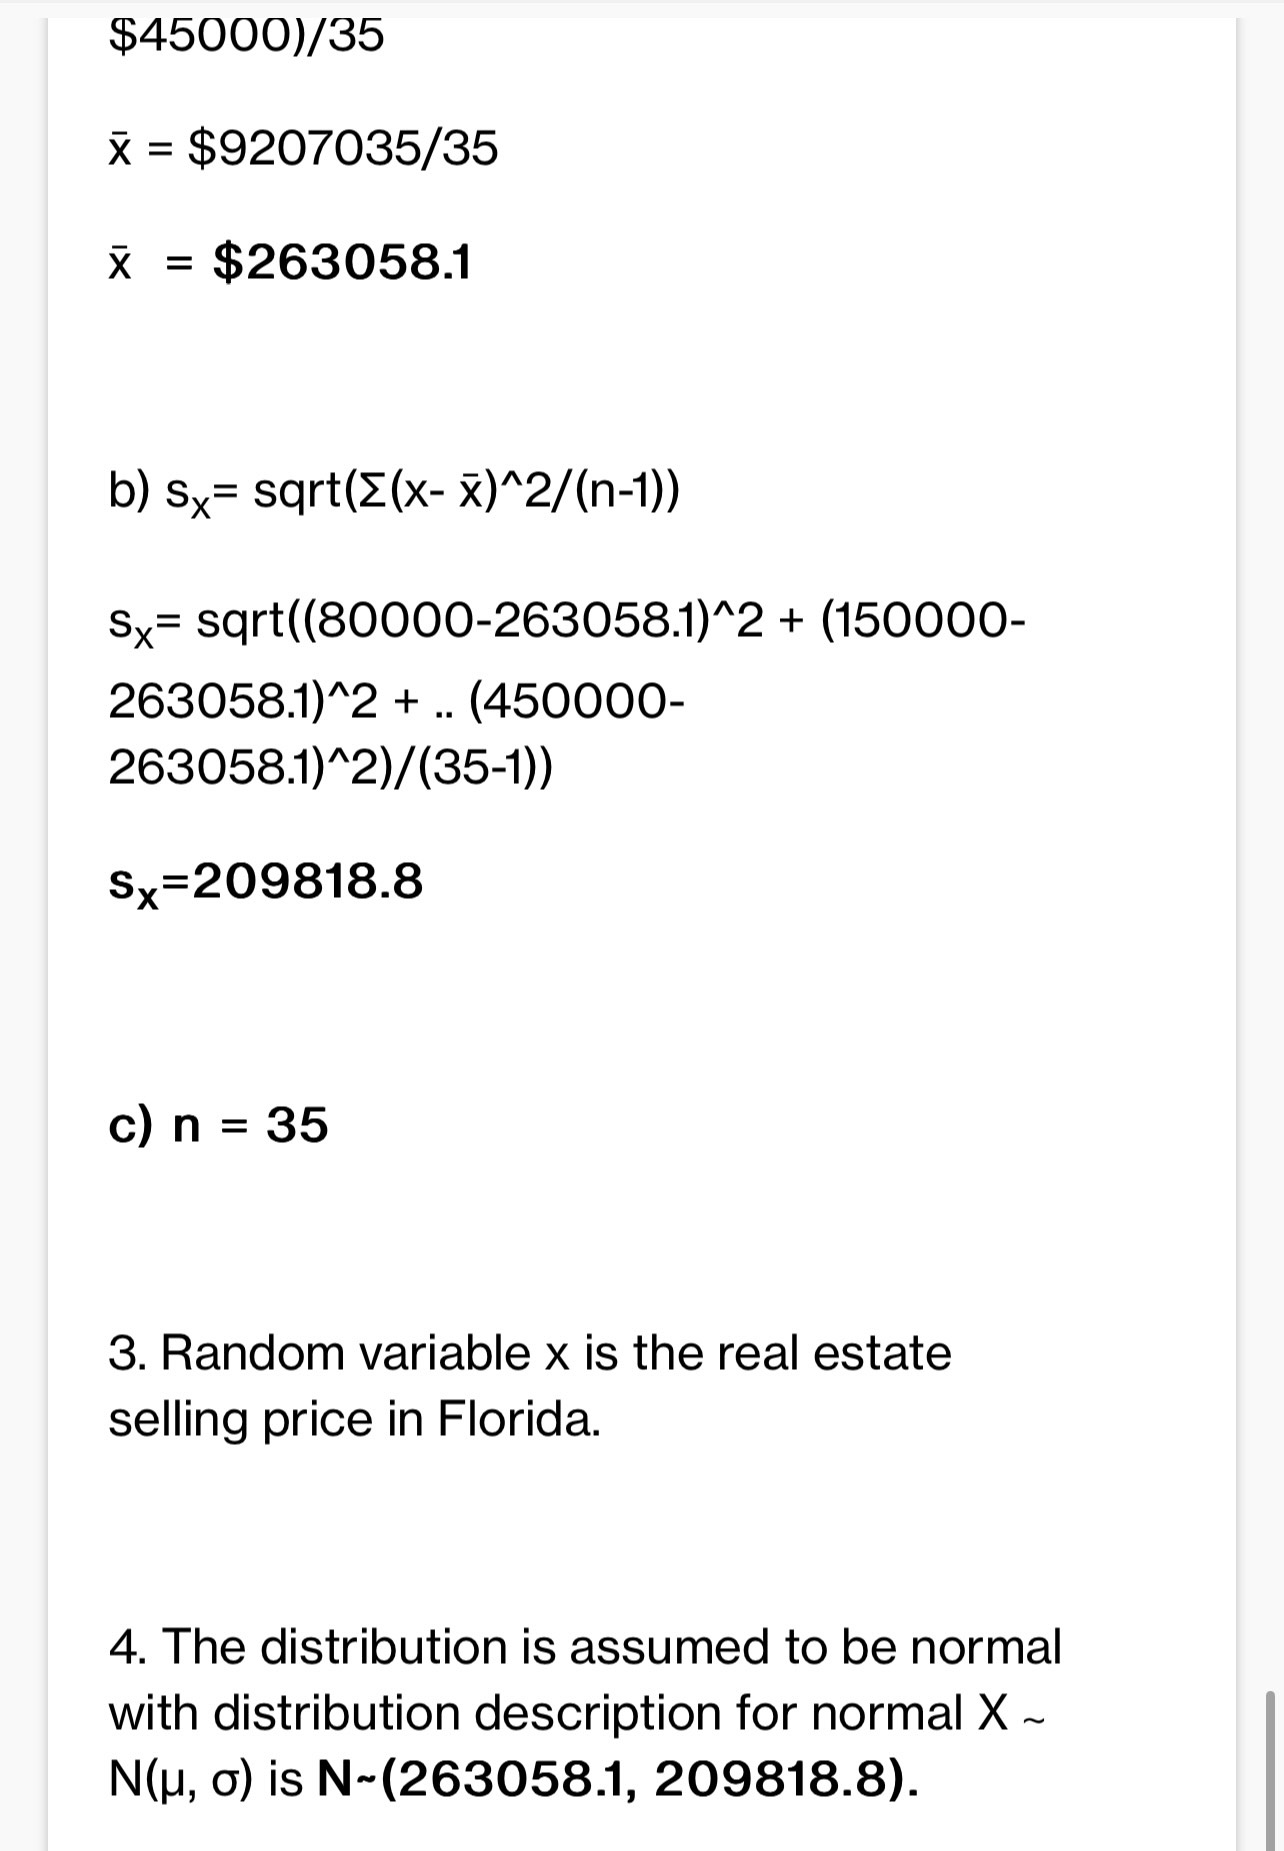
\f$45000)/35 X = $9207035/35 X = $263058.1 b) sy= sqrt(E(x- x) ^2/(n-1)) SX= sqrt((80000-263058.1)^2 + (150000- 263058.1)^2 + .. (450000- 263058.1)^2)/(35-1)) Sy=209818.8 c) n = 35 3. Random variable x is the real estate selling price in Florida. 4. The distribution is assumed to be normal with distribution description for normal X ~ N(H, o) is N~(263058.1, 209818.8)
Step by Step Solution
There are 3 Steps involved in it

Get step-by-step solutions from verified subject matter experts