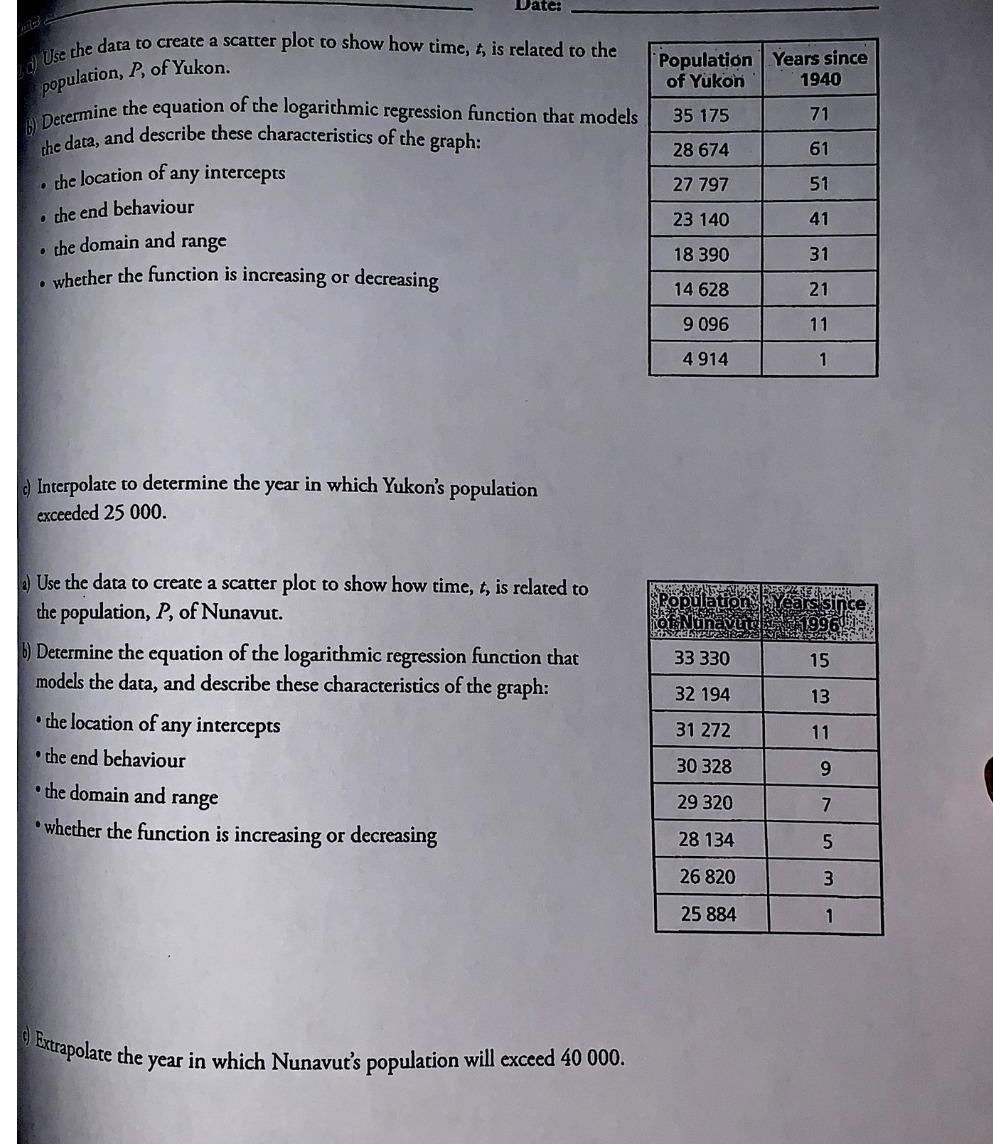
Question: Use the data to create a scatter plot to show how time, t, is related to the Population Years since population, P, of Yukon. of

Use the data to create a scatter plot to show how
Use the data to create a scatter plot to show how time, t, is related to the Population Years since population, P, of Yukon. of Yukon 1940 b) Determine the equation of the logarithmic regression function that models 35 175 71 the data, and describe these characteristics of the graph: 28 674 61 . the location of any intercepts 27 797 51 the end behaviour 23 140 41 the domain and range 18 390 31 whether the function is increasing or decreasing 14 628 21 9 096 11 4 914 1 c Interpolate to determine the year in which Yukon's population exceeded 25 000. ) Use the data to create a scatter plot to show how time, t, is related to the population, P, of Nunavut. of NunavutEP 19960 7- Determine the equation of the logarithmic regression function that 33 330 15 models the data, and describe these characteristics of the graph: 32 194 13 . the location of any intercepts 31 272 11 the end behaviour 30 328 9 . the domain and range 29 320 7 . whether the function is increasing or decreasing 28 134 5 26 820 3 25 884 1 () Extrapolate the year in which Nunavut's population will exceed 40 000

Step by Step Solution

There are 3 Steps involved in it

1 Expert Approved Answer
Step: 1 Unlock blur-text-image
Question Has Been Solved by an Expert!

Get step-by-step solutions from verified subject matter experts

Step: 2 Unlock
Step: 3 Unlock

Students Have Also Explored These Related Mathematics Questions!