

Question: use the dataset to answer the question Exhibit 2 includes the results of an Analysis of Variance (ANOVA). Which of the following best represents the
 use the dataset to answer the question
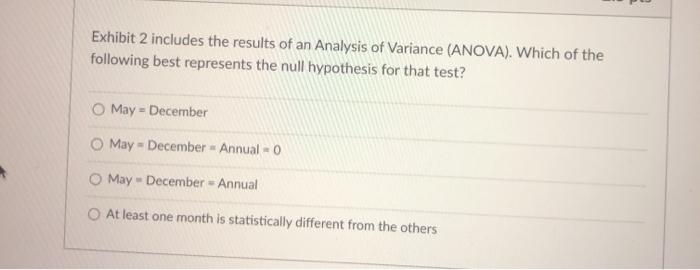
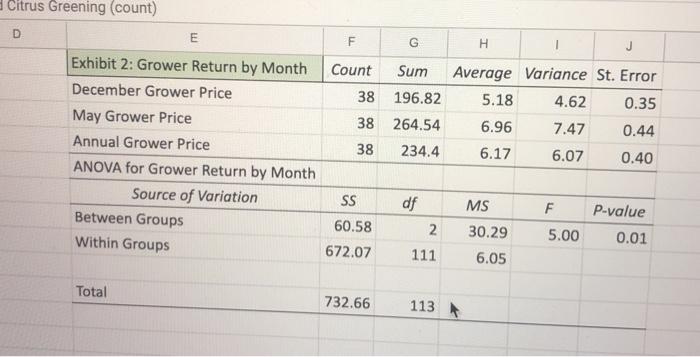
Exhibit 2 includes the results of an Analysis of Variance (ANOVA). Which of the following best represents the null hypothesis for that test? O May - December May - December Annual - 0 May - December - Annual At least one month is statistically different from the others Citrus Greening (count) D E F G H J Count Sum 38 196.82 Exhibit 2: Grower Return by Month December Grower Price May Grower Price Annual Grower Price ANOVA for Grower Return by Month Source of Variation Between Groups Within Groups Average Variance St. Error 5.18 4.62 0.35 6.96 7.47 0.44 6.17 6.07 0.40 38 264.54 234.4 38 SS df MS F P-value 2 60.58 672.07 30.29 5.00 0.01 111 6.05 Total 732.66 113
Step by Step Solution
There are 3 Steps involved in it

Get step-by-step solutions from verified subject matter experts