

In this project, you will use the diamonds dataset and answer the questions. This classic dataset...
Fantastic news! We've Found the answer you've been seeking!
Transcribed Image Text:
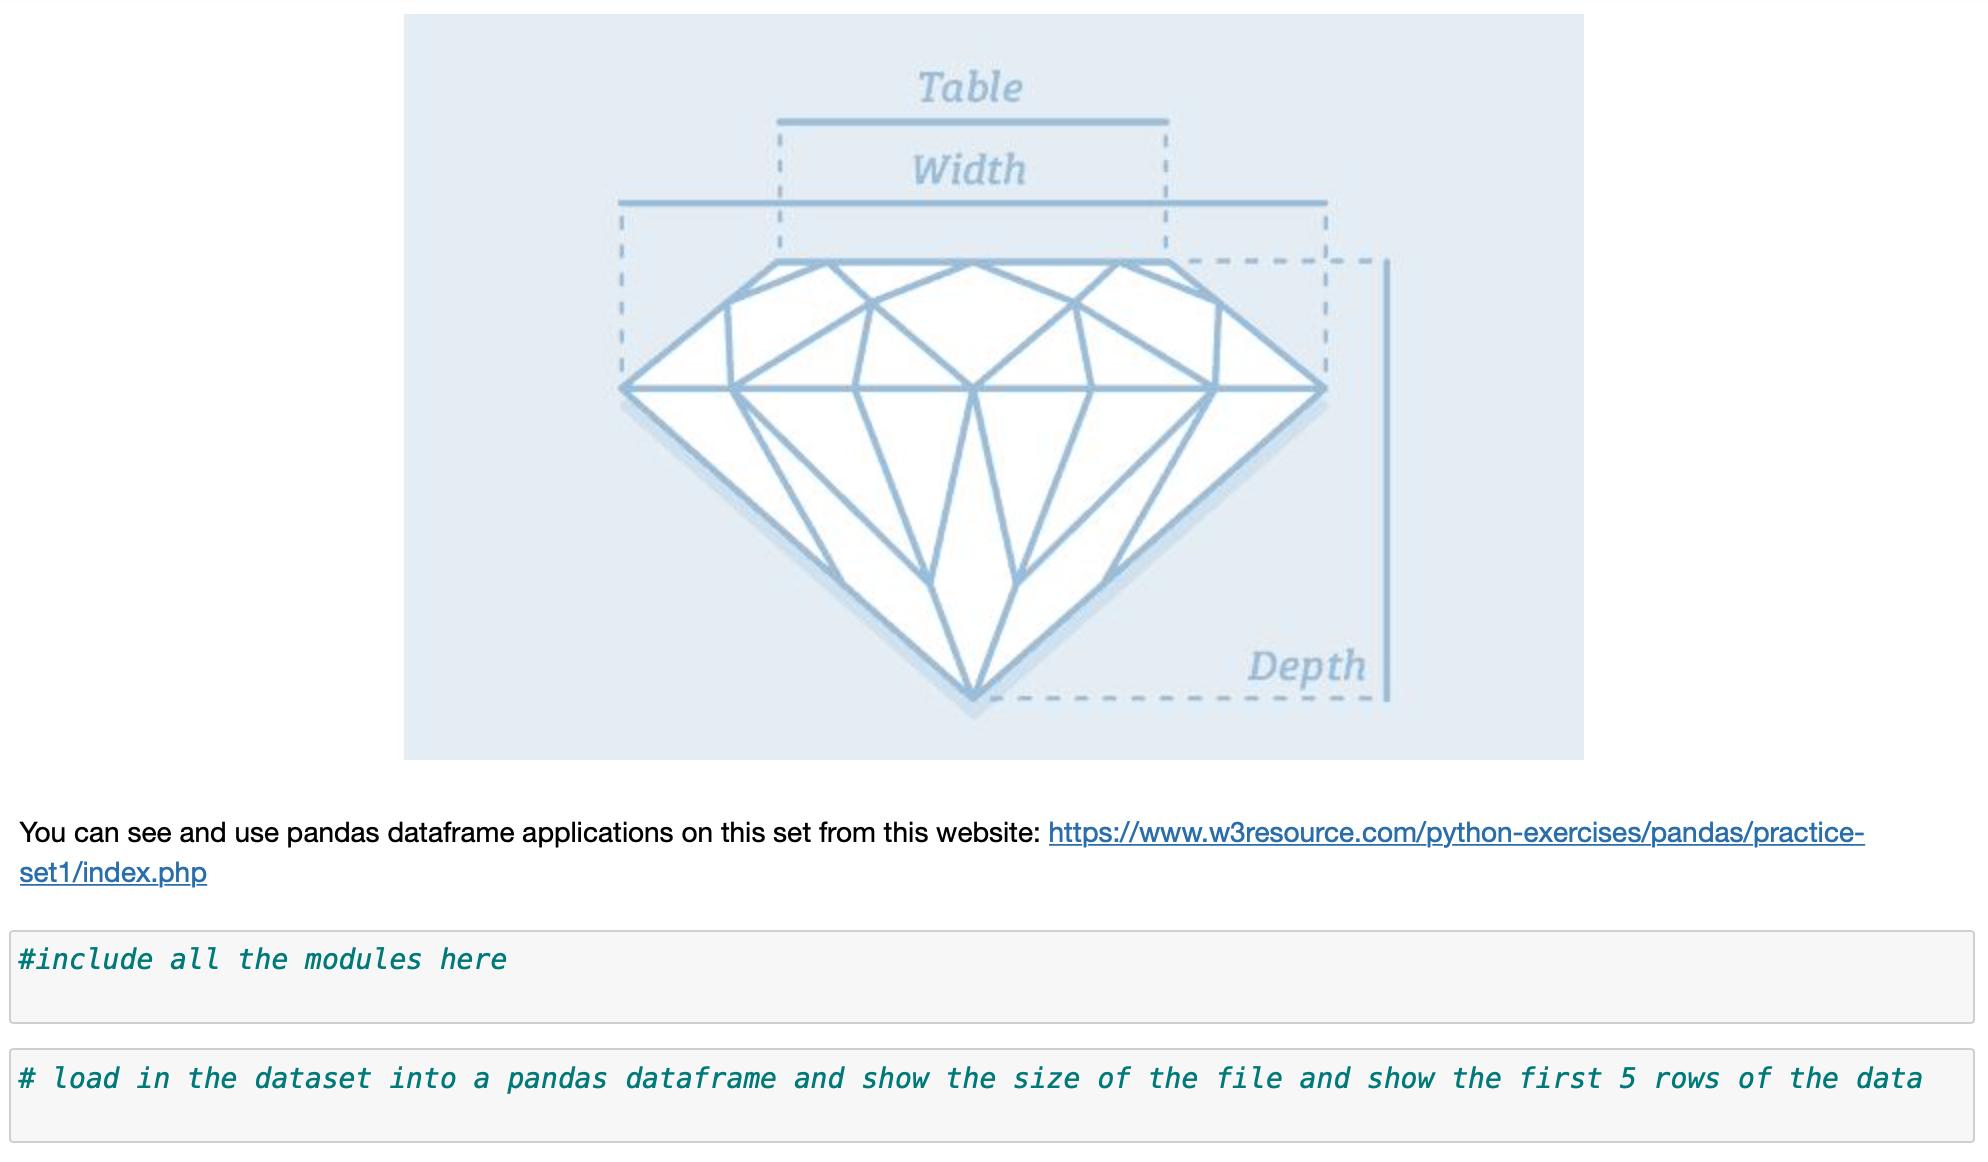
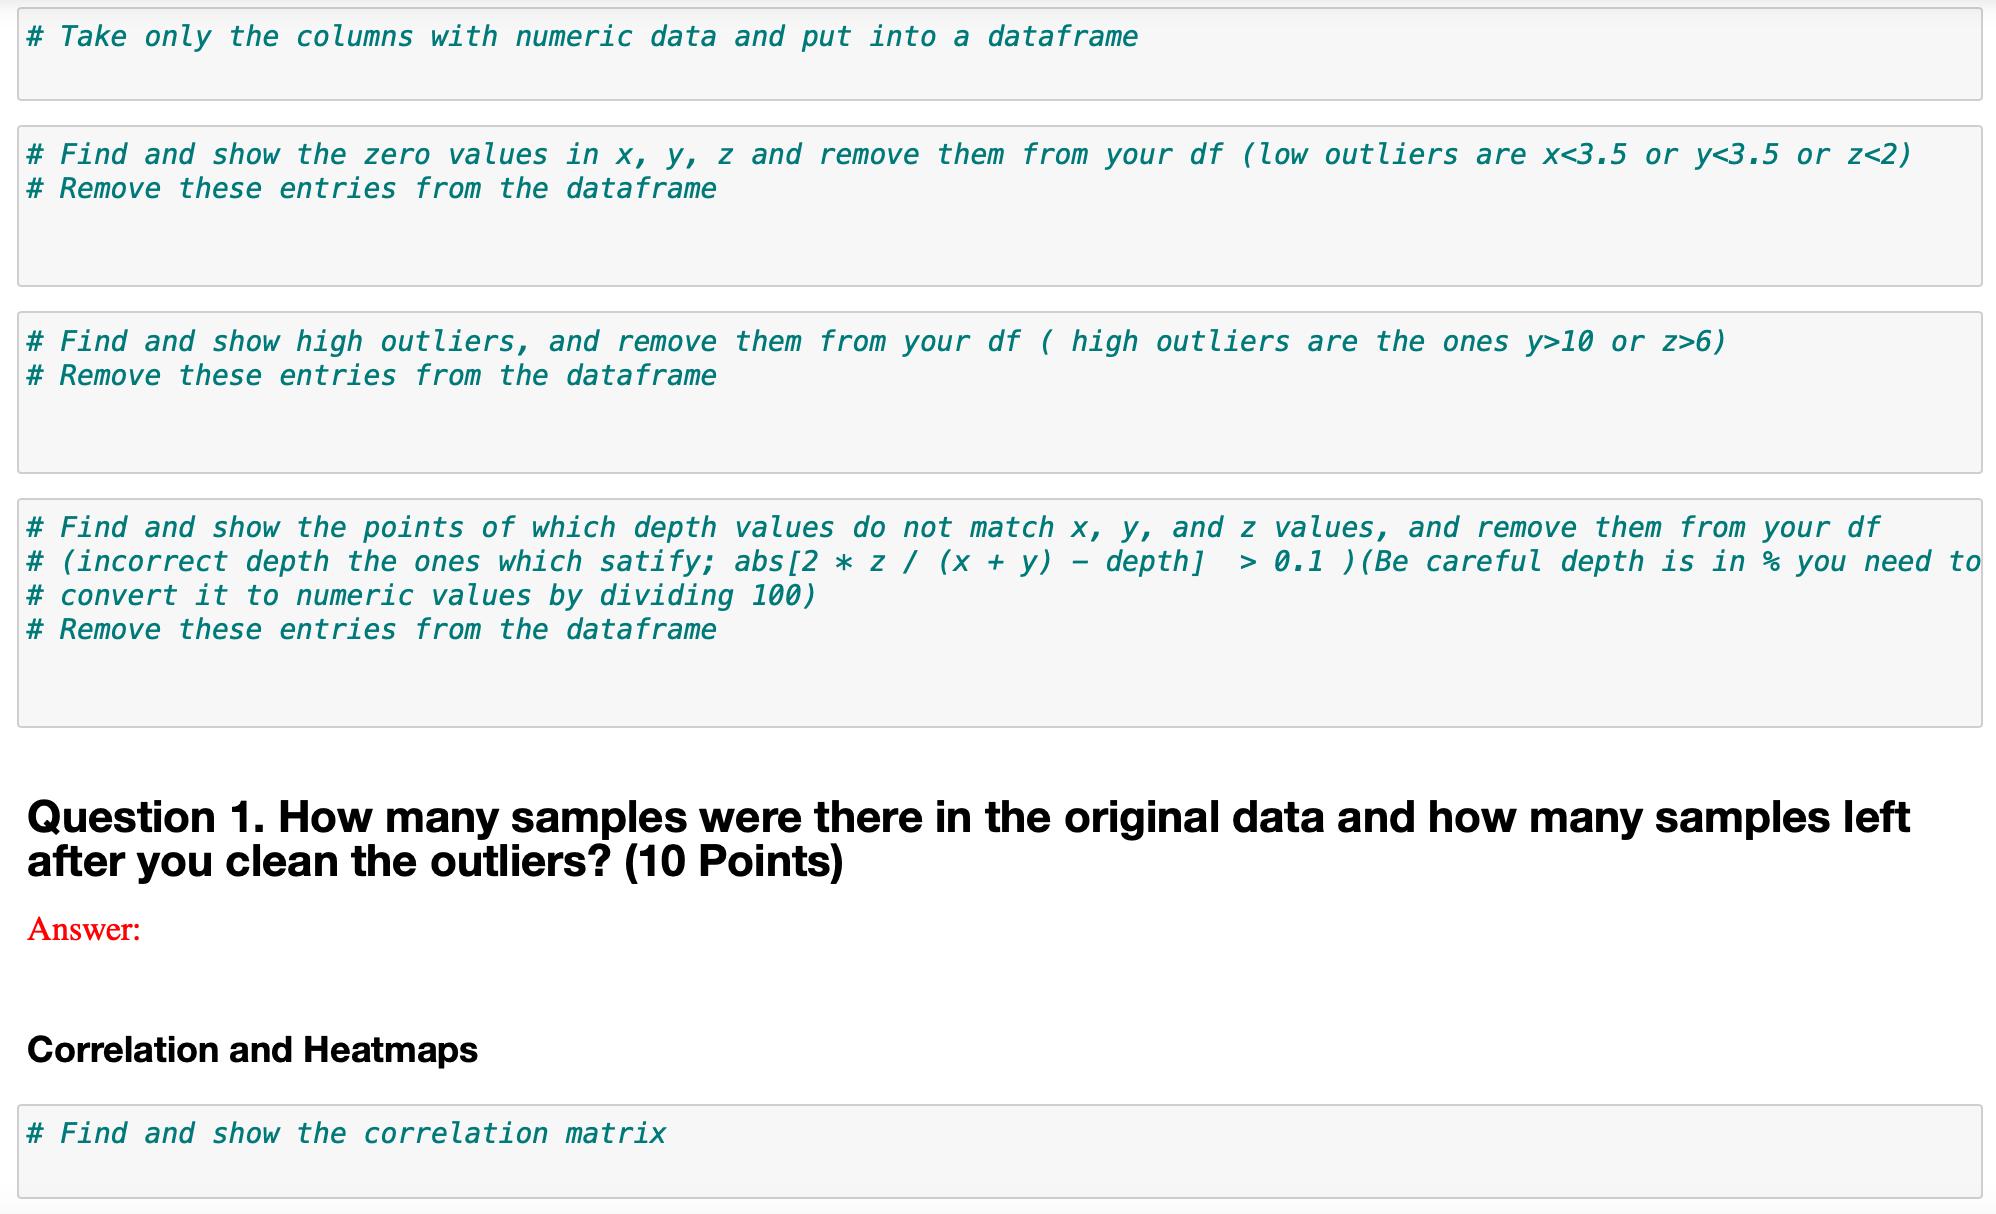
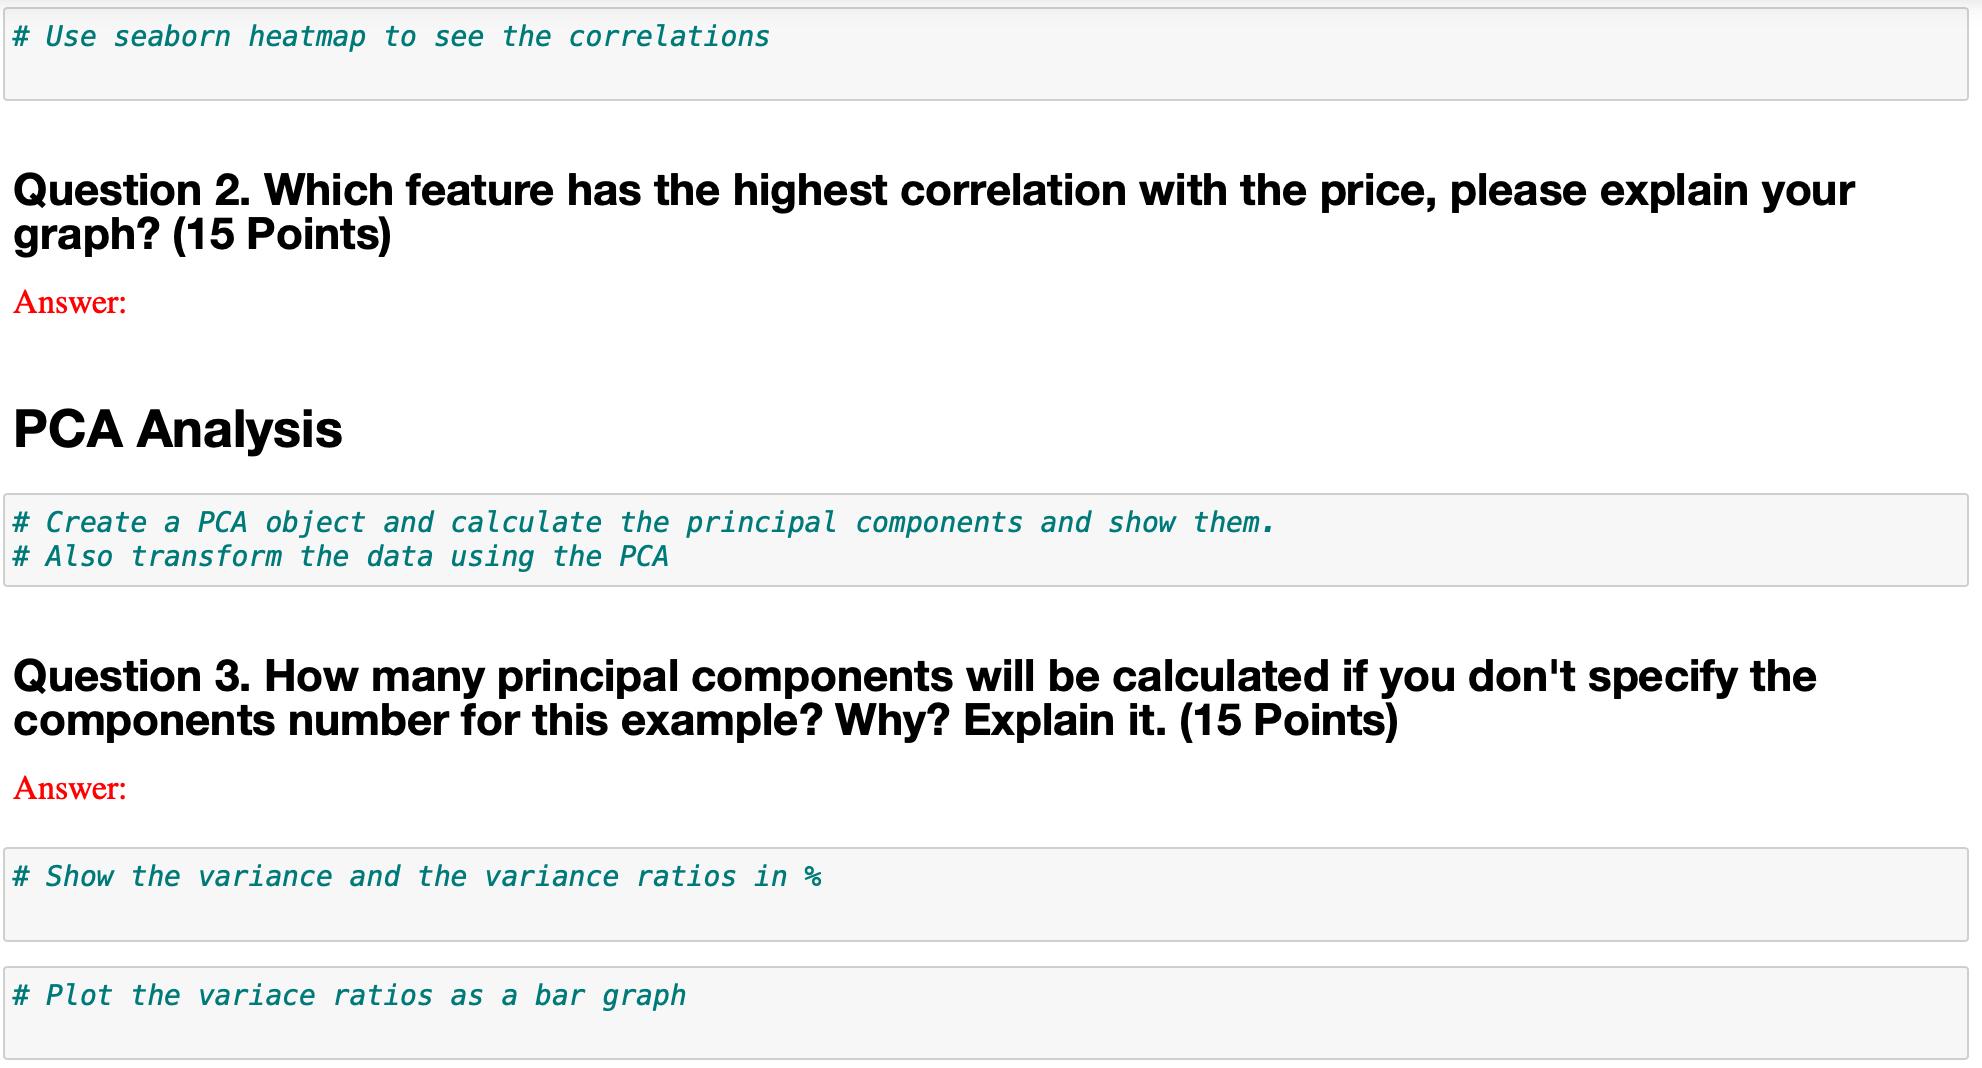
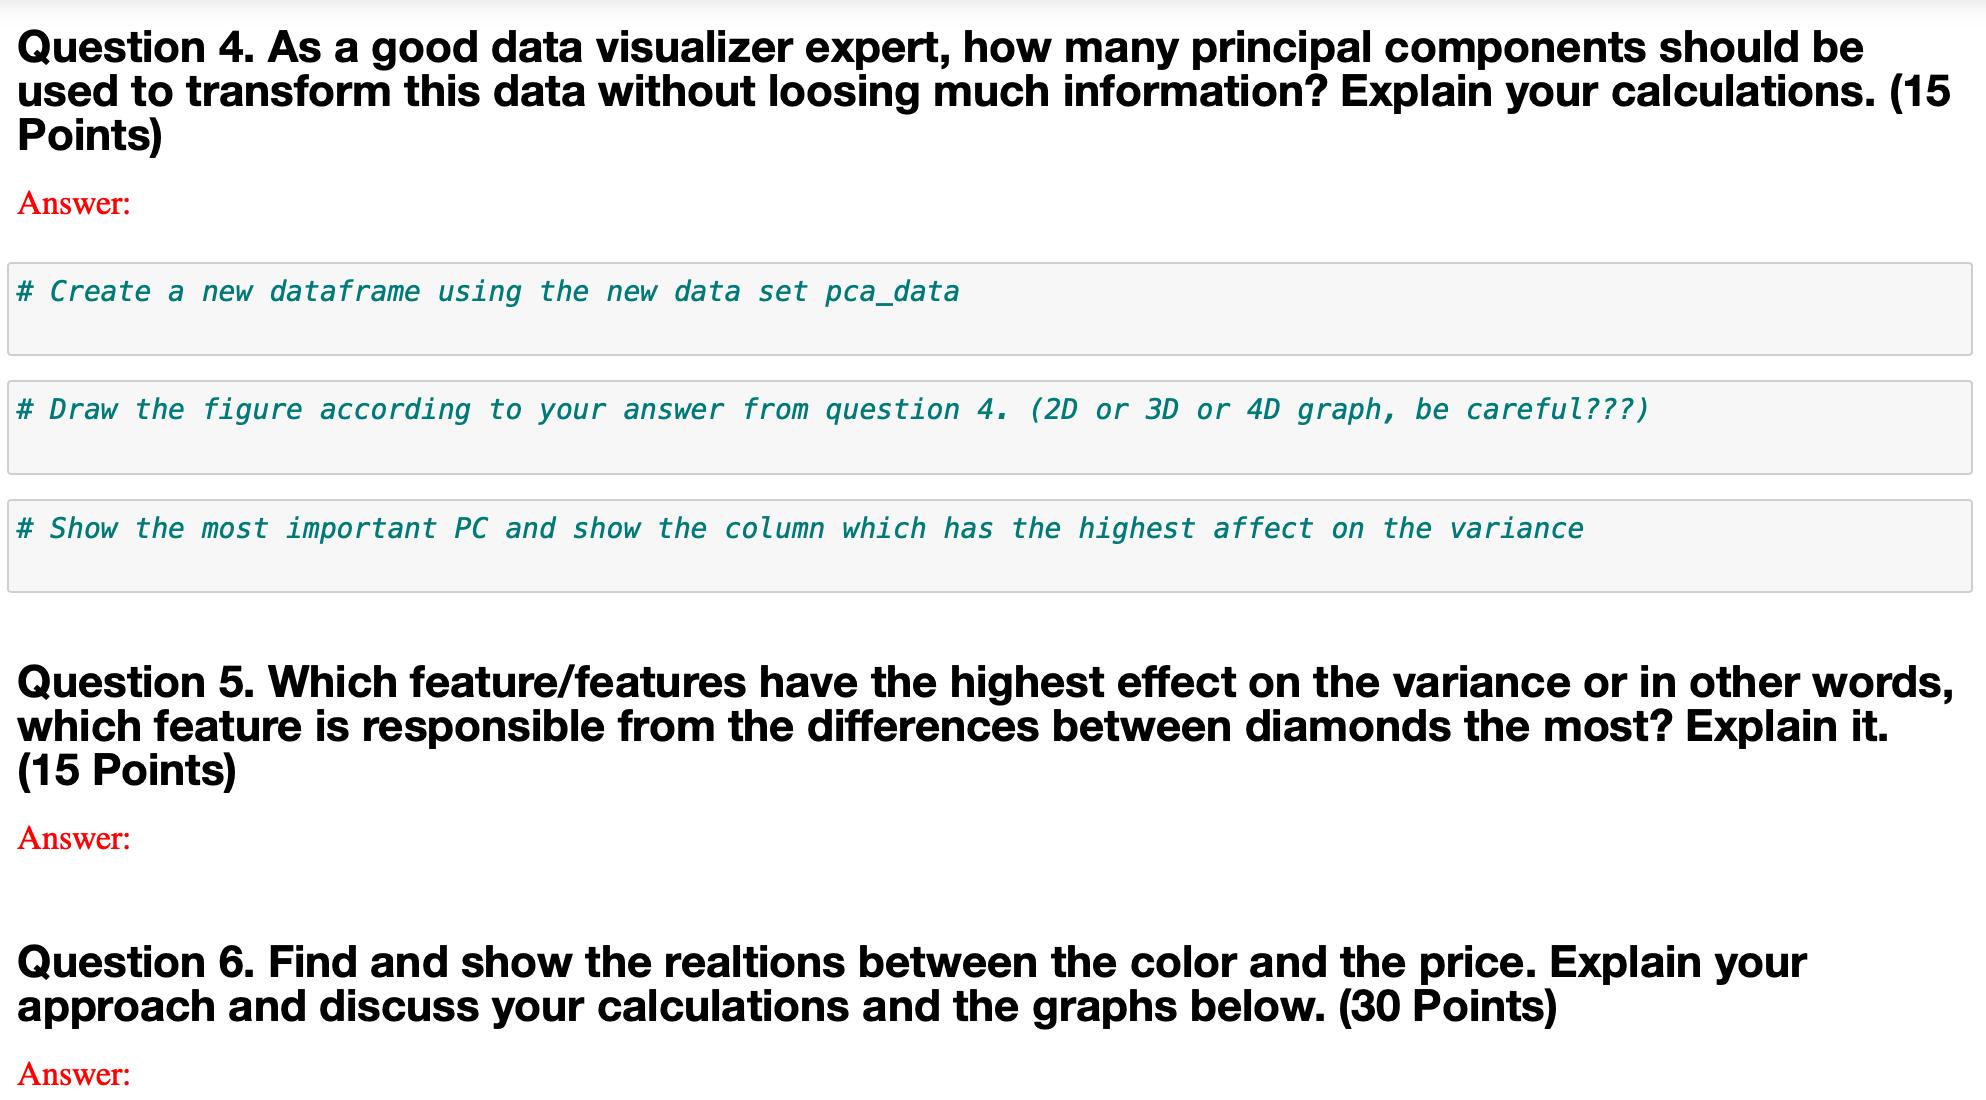
In this project, you will use the diamonds dataset and answer the questions. This classic dataset contains the prices and other attributes of almost 54,000 diamonds. It's a great dataset for beginners learning to work with data analysis and visualization. Content price--> price in US dollars (range is between $326 and $18,823) carat--> weight of the diamond (range is between 0.2 and 5.01) cut--> quality of the cut (Fair, Good, Very Good, Premium, Ideal) color--> diamond colour, from J (worst) to D (best) clarity--> a measurement of how clear the diamond is (11 (worst), SI2, SI1, VS2, VS1, VVS2, VVS1, IF (best)) x--> length in mm (range is between 0 and 10.74) y--> width in mm (range is between 0 and 58.9) Z--> depth in mm (range is between 0 and 31.8) depth--> total depth percentage = z / mean(x, y) = 2*z / (x + y) (range is between 43 and 79) table--> width of top of diamond relative to widest point (range is between 43-95) Table Width #include all the modules here Depth You can see and use pandas dataframe applications on this set from this website: https://www.w3resource.com/python-exercises/pandas/practice- set1/index.php #load in the dataset into a pandas dataframe and show the size of the file and show the first 5 rows of the data # Take only the columns with numeric data and put into a dataframe # Find and show the zero values in x, y, z and remove them from your df (low outliers are x<3.5 or y<3.5 or z<2) # Remove these entries from the data frame # Find and show high outliers, and remove them from your df (high outliers are the ones y>10 or z>6) # Remove these entries from the data frame # Find and show the points of which depth values do not match x, y, and z values, and remove them from your df # (incorrect depth the ones which satify; abs [2* z / (x + y) - depth] > 0.1 ) (Be careful depth is in % you need to # convert it to numeric values by dividing 100) # Remove these entries from the dataframe Question 1. How many samples were there in the original data and how many samples left after you clean the outliers? (10 Points) Answer: Correlation and Heatmaps # Find and show the correlation matrix # Use seaborn heatmap to see the correlations Question 2. Which feature has the highest correlation with the price, please explain your graph? (15 Points) Answer: PCA Analysis # Create a PCA object and calculate the principal components and show them. # Also transform the data using the PCA Question 3. How many principal components will be calculated if you don't specify the components number for this example? Why? Explain it. (15 Points) Answer: # Show the variance and the variance ratios in % # Plot the variace ratios as a bar graph Question 4. As a good data visualizer expert, how many principal components should be used to transform this data without loosing much information? Explain your calculations. (15 Points) Answer: # Create a new dataframe using the new data set pca_data # Draw the figure according to your answer from question 4. (2D or 3D or 4D graph, be careful???) # Show the most important PC and show the column which has the highest affect on the variance Question 5. Which feature/features have the highest effect on the variance or in other words, which feature is responsible from the differences between diamonds the most? Explain it. (15 Points) Answer: Question 6. Find and show the realtions between the color and the price. Explain your approach and discuss your calculations and the graphs below. (30 Points) Answer: In this project, you will use the diamonds dataset and answer the questions. This classic dataset contains the prices and other attributes of almost 54,000 diamonds. It's a great dataset for beginners learning to work with data analysis and visualization. Content price--> price in US dollars (range is between $326 and $18,823) carat--> weight of the diamond (range is between 0.2 and 5.01) cut--> quality of the cut (Fair, Good, Very Good, Premium, Ideal) color--> diamond colour, from J (worst) to D (best) clarity--> a measurement of how clear the diamond is (11 (worst), SI2, SI1, VS2, VS1, VVS2, VVS1, IF (best)) x--> length in mm (range is between 0 and 10.74) y--> width in mm (range is between 0 and 58.9) Z--> depth in mm (range is between 0 and 31.8) depth--> total depth percentage = z / mean(x, y) = 2*z / (x + y) (range is between 43 and 79) table--> width of top of diamond relative to widest point (range is between 43-95) Table Width #include all the modules here Depth You can see and use pandas dataframe applications on this set from this website: https://www.w3resource.com/python-exercises/pandas/practice- set1/index.php #load in the dataset into a pandas dataframe and show the size of the file and show the first 5 rows of the data # Take only the columns with numeric data and put into a dataframe # Find and show the zero values in x, y, z and remove them from your df (low outliers are x<3.5 or y<3.5 or z<2) # Remove these entries from the data frame # Find and show high outliers, and remove them from your df (high outliers are the ones y>10 or z>6) # Remove these entries from the data frame # Find and show the points of which depth values do not match x, y, and z values, and remove them from your df # (incorrect depth the ones which satify; abs [2* z / (x + y) - depth] > 0.1 ) (Be careful depth is in % you need to # convert it to numeric values by dividing 100) # Remove these entries from the dataframe Question 1. How many samples were there in the original data and how many samples left after you clean the outliers? (10 Points) Answer: Correlation and Heatmaps # Find and show the correlation matrix # Use seaborn heatmap to see the correlations Question 2. Which feature has the highest correlation with the price, please explain your graph? (15 Points) Answer: PCA Analysis # Create a PCA object and calculate the principal components and show them. # Also transform the data using the PCA Question 3. How many principal components will be calculated if you don't specify the components number for this example? Why? Explain it. (15 Points) Answer: # Show the variance and the variance ratios in % # Plot the variace ratios as a bar graph Question 4. As a good data visualizer expert, how many principal components should be used to transform this data without loosing much information? Explain your calculations. (15 Points) Answer: # Create a new dataframe using the new data set pca_data # Draw the figure according to your answer from question 4. (2D or 3D or 4D graph, be careful???) # Show the most important PC and show the column which has the highest affect on the variance Question 5. Which feature/features have the highest effect on the variance or in other words, which feature is responsible from the differences between diamonds the most? Explain it. (15 Points) Answer: Question 6. Find and show the realtions between the color and the price. Explain your approach and discuss your calculations and the graphs below. (30 Points) Answer:
Expert Answer:

Related Book For 

Posted Date:
Students also viewed these algorithms questions
-
Use the definition of a derivative to show that if f(x) = 1/x, then f'(x) = -1/x2. (This proves the Power Rule for the case n = - 1.)
-
Use the definition of a linear space to show that 1. x + y = x + z ^ y = z 2. ax = ay and a 0 x = y 3. ax = x and x 0 a = fi 4. ( - )x = x - x 5. (x - y) = x - y 6. 0 = 0 for all x, y, z X and ,...
-
Use the definition of projection, as stated here, for problems a to b A linear transformation T: V W, where W is a sub-space of V, is called a projection provided that T, when restricted to W,...
-
Bank A has increased its leverage from 2016 to 2017 as shown below. Assume the bank invests in plain loans which yield an annual interest of 5% in both years. The annual interest paid on liabilities...
-
Why is a focus on the customer such a key principle of target costing?
-
For the year ended December 31, 2018, Westlake Ltd. had the following transactions related to the purchase of property. Assume all transactions are for cash unless otherwise stated. Feb. 7 Purchased...
-
A university pumps its water from wells located on campus. The falling water table has caused pumping costs to increase, the quantity of water available to decrease, and the quality of water to...
-
Meadowlands Design produces head covers for golf clubs. The company expects to generate a profit next year. It anticipates fixed manufacturing costs of $200,500 and fixed general and administrative...
-
What is Martin Gardner's argument for the objectivist view of art? Do you agree? Why or why not? Use Vaughns textbook to help you explain Gardners theory and its strengths and weaknesses. Choose an...
-
Survey two relatives or friends and ask about their decision-making process when they most recently bought a vehicle. Find out if they thought about the opportunity costs when making the purchase....
-
Benny and June are meeting with Gwen, an insurance representative, to discuss purchasing an insurance policy. To determine the right amount of insurance, Gwen works with the couple to calculate the...
-
5. What will be the output of each printf statement? #define HI 1 #define BY O #define NUM 23 #define OOPS '0' printf("%c", 'a'); printf("%x", 15); printf("%d %d.%c%d ", HI, NUM, OOPS, BY);
-
Tableau DA C-3 (Static): Mini-Case, Reporting stock investments on financial statements LO P4 As financial reporting advisors, we are asked by the head of Sterling Co. to advise in accounting for...
-
Write a program that will give the same output as the one below using logic operations instead of bitwise operations. (C Language) int ques_one(int x) { int m8 = 0x55; int m16 m8 | m8 < < 8; int m32...
-
ALLIED PRODUCTS, INC. In the summer of 2015, Amax Corporation had completed an ambitious P100 million expansion program which would allow Amax to sell special alloy bars and sheets for various...
-
Mr. Aggarwal has been managing the portfolios of a large mutual fund for the last two years. The individual details are as follows: Portfolio A Actual return earned = 50% Standard deviation of...
-
TLC Company has collected the following data for 2019: Sales 475,000 Costs 298,000 Assets 600,000 Debt 200,000 400,000 55,932 21% Equity Dividends Tax rate The board of XYZ would like sales to grow...
-
In Exercises delete part of the domain so that the function that remains is one-to-one. Find the inverse function of the remaining function and give the domain of the inverse function. f(x) = 16x4 -3...
-
Assume that all of the functions are twice differentiable and the second derivatives are never 0. (a) If f and are positive, increasing, concave upward functions on I, show that the product function...
-
Find an equation of the tangent to the curve at the point corresponding to the given value of the parameter. x = 1 + 4t - t2, y = 2 - t3, t = 1
-
Suppose f(x) is the probability density function for the weight of a female college student, where is measured in pounds. (a) What is the meaning of the integral (b) Write an expression for the mean...
-
Using the data in Tables 7.13 and 7.14, does this farm qualify for debt (i.e., is the farm profitable, liquid, and solvent)? Table 7.13 Table 7.14 Item 2006 2007 2008 2009 2010 2011 2012 Gross cash...
-
The book basis of depreciable assets for Erwin Co. is 900,000 and the tax basis is 700,000 at the end of 2015. The enacted tax rate is 34% for all periods. Determine the amount of deferred taxes to...
-
How does an asset gain or loss develop in pension accounting?

Study smarter with the SolutionInn App