

Question: Use the distance matrix shown in the table below to perform single and complete link hierarchical clustering. Show your results by drawing a dendrogram. The
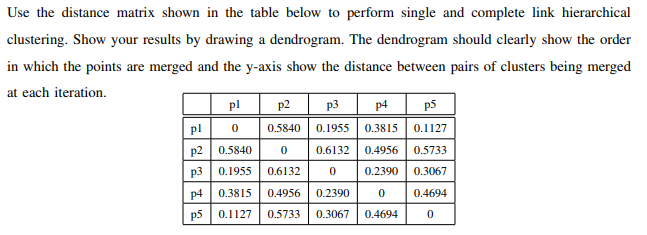
Use the distance matrix shown in the table below to perform single and complete link hierarchical clustering. Show your results by drawing a dendrogram. The dendrogram should clearly show the order in which the points are merged and the y-axis show the distance between pairs of clusters being merged at each iteration. p 0 0.5840 0.1955 0.3815 0.1127 p2 0.5840 00.6132 0.4956 0.5733 p3 0.1955 0.6132 0 0.2390 0.3067 p4 0.3815 0.4956 0.239000.4694 p5 0.1127 0.5733 0.3067 0.46940 Use the distance matrix shown in the table below to perform single and complete link hierarchical clustering. Show your results by drawing a dendrogram. The dendrogram should clearly show the order in which the points are merged and the y-axis show the distance between pairs of clusters being merged at each iteration. p 0 0.5840 0.1955 0.3815 0.1127 p2 0.5840 00.6132 0.4956 0.5733 p3 0.1955 0.6132 0 0.2390 0.3067 p4 0.3815 0.4956 0.239000.4694 p5 0.1127 0.5733 0.3067 0.46940
Step by Step Solution
There are 3 Steps involved in it

Get step-by-step solutions from verified subject matter experts