

Question: Use the Distributions tool to develop the rejection region. According to the rejection region method (with a =0.05 ), when do you reject the null
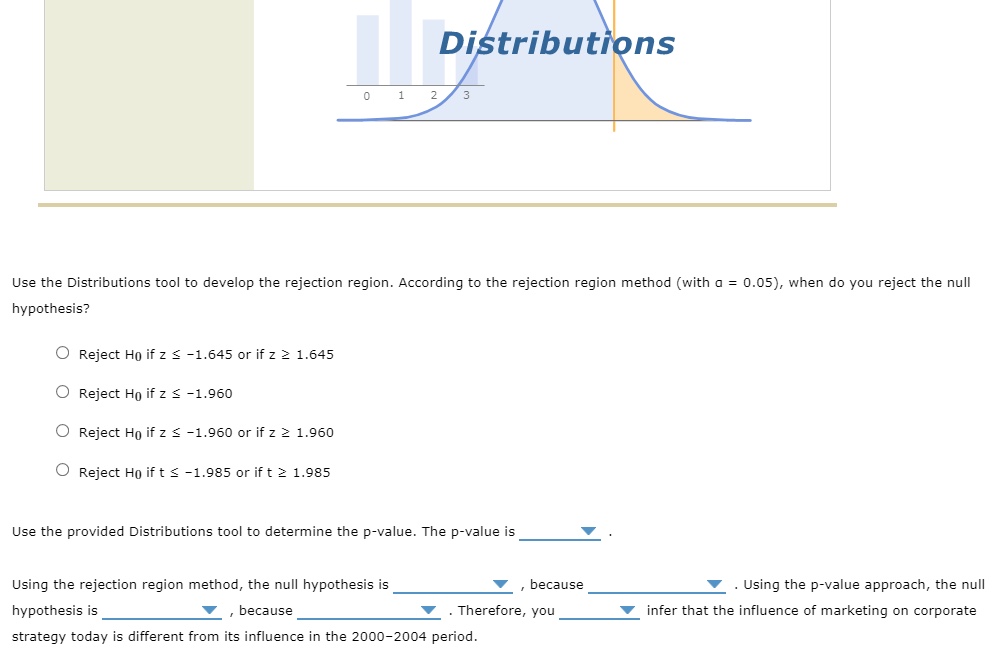
Use the Distributions tool to develop the rejection region. According to the rejection region method (with a =0.05 ), when do you reject the null hypothesis? Reject H0 if z1.645 or if z1.645 Reject H0 if z1.960 Reject H0 if z1.960 or if z1.960 Reject H0 if t1.985 or if t1.985 Use the provided Distributions tool to determine the p-value. The p-value is Using the rejection region method, the null hypothesis is because . Using the p-value approach, the null hypothesis is , because . Therefore, you infer that the influence of marketing on corporate strategy today is different from its influence in the 20002004 period. A firm's corporate strategy is driven largely by its top management team. One method of gauging the influence of marketing on corporate strategy is to measure the proportion of firms with a chief marketing officer on their top management team. Over the 5-year period from 2000 to 2004 , 42% of firms had a chief marketing officer on their top management team. [Source: Pravin Nath and Vijay Mahajan, "Chief Marketing Officers: A Study of Their Presence in Firms' Top Management Teams," Journal of Marketing, 70 (2007).] To test the hypothesis that the influence of marketing on corporate strategy today is different from its influence in the 20002004 period, a random sample of 97 U.S. firms is selected. Of these, 31 firms have a chief marketing officer on their top management team. The test is conducted at a significance level of a=0.05. Let p be the true proportion of firms with a chief marketing officer currently on their top management team. To conduct the hypothesis test, the null and alternative hypotheses are formulated as: H0:p0.42;H1:p0.42 If the null hypothesis is true, the sampling distribution of the sample proportion P can be approximated by a with a mean and a standard deviation of The test statistic is
Step by Step Solution
There are 3 Steps involved in it

Get step-by-step solutions from verified subject matter experts