

Question: Use the dropdowns below to input the code required to complete this graph. Ignore/disregard the whitespace on either side of the brackets (assume there is
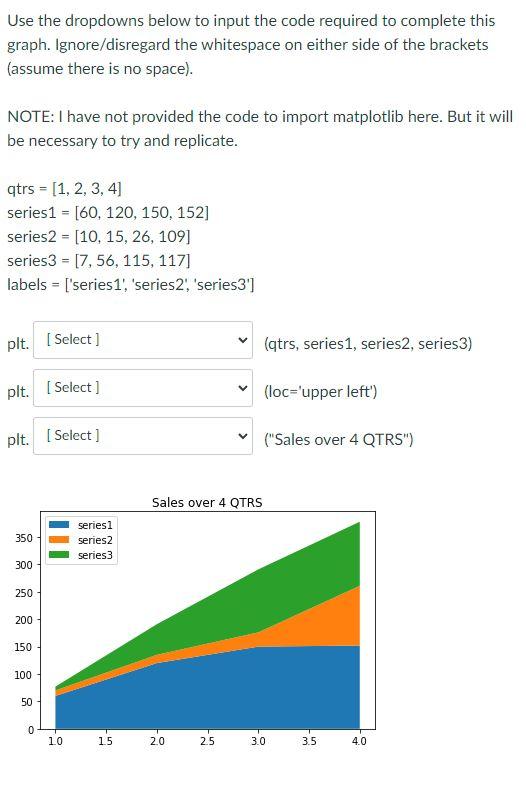
Use the dropdowns below to input the code required to complete this graph. Ignore/disregard the whitespace on either side of the brackets (assume there is no space). NOTE: I have not provided the code to import matplotlib here. But it will be necessary to try and replicate. qtrs=[1,2,3,4]series1=[60,120,150,152]series2=[10,15,26,109]series3=[7,56,115,117]labels=[series1,series2,series3] plt. (qtrs, series1, series2, series 3 ) plt. (loc='upper left') plt. ("Sales over 4 QTRS")
Step by Step Solution
There are 3 Steps involved in it
To replicate the graph shown you need to use the appropriate matplotlib functions Here is the corre... View full answer

Get step-by-step solutions from verified subject matter experts