

Question: Use the Excel file Asset Allocation Data to determine the following: Variances for the individual assets Standard deviations for the individual assets Covariances between each
Use the Excel file Asset Allocation Data to determine the following:
- Variances for the individual assets
- Standard deviations for the individual assets
- Covariances between each pair of Assets (e.g., Covariance between Asset 1 and Asset 2, et)
- Portfolio weights for both Portfolio 1 and Portfolio 2
- Means (Expected Returns) for both Portfolio 1 and Portfolio 2
- Variances for both Portfolio 1 and Portfolio 2
- Standard Deviations for both Portfolio 1 and Portfolio 2
- Covariance between Portfolio 1 and Portfolio 2
- Correlation between Portfolio 1 and Portfolio 2
- Create a one-way data table using EXCELs Data Table feature that determines the different means and standard deviations for combinations of Portfolio 1 and Portfolio 2 by varying the proportion of Portfolio 1. For Portfolio 1 use proportions ranging from -4 to + 4 in increments of 0.5.
- Graph the combinations of the portfolios from the one-way data table and add the individual asset returns to the graph.
- Could the portfolio combinations be on the efficient frontier? Why or why not?
- Using Solver, find an envelope portfolio that would yield an expected return of 10%. What would be the corresponding portfolio standard deviation?
- Using Solver, find two envelope portfolios that would yield a standard deviation of 40%. What would be the corresponding expected returns for each of these portfolios?
- Using Solver, find the envelope portfolio that would yield the smallest (minimum) standard deviation. What would be the corresponding expected return for this portfolio?
*please show all work
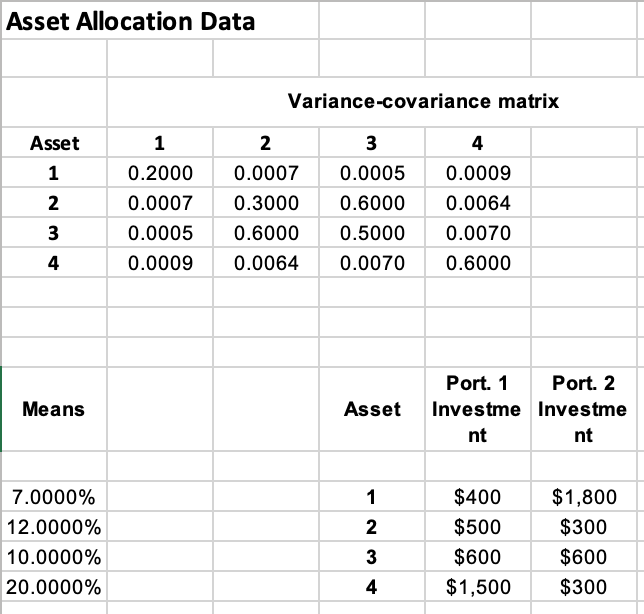
Asset Allocation Data Variance-covariance matrix 1 Asset 1 2 Nm 0.2000 0.0007 0.0005 0.0009 2 0.0007 0.3000 0.6000 0.0064 3 0.0005 0.6000 0.5000 0.0070 4 0.0009 0.0064 0.0070 0.6000 4 Means Asset Port. 1 Port. 2 Investme Investme nt nt 7.0000% 12.0000% 10.0000% 20.0000% 1 2 3 $400 $500 $1,800 $300 $600 $300 $600 $1,500 4 Asset Allocation Data Variance-covariance matrix 1 Asset 1 2 Nm 0.2000 0.0007 0.0005 0.0009 2 0.0007 0.3000 0.6000 0.0064 3 0.0005 0.6000 0.5000 0.0070 4 0.0009 0.0064 0.0070 0.6000 4 Means Asset Port. 1 Port. 2 Investme Investme nt nt 7.0000% 12.0000% 10.0000% 20.0000% 1 2 3 $400 $500 $1,800 $300 $600 $300 $600 $1,500 4
Step by Step Solution
There are 3 Steps involved in it

Get step-by-step solutions from verified subject matter experts