

Question: Use the Excel file that has financial data for three department stores to complete this assignment. Write a report where you assess the three companies
Use the Excel file that has financial data for three department stores to complete this assignment.
Write a report where you assess the three companies and determine which the best is managed of the three. You must use at least two profitability ratios, two asset management ratios and two other ratios of your choice. You must show the values for each ratio for each firm. You must explain what information the ratio provides and why management cares about this.
You must create a ratio that is new, that is not something that we discussed in class. It must be relevant to all three companies, and it must provide management with additional information about how well their company is being run. You must state the numerator and denominator and explain what information the ratio provides.
The report must be a written not a bulleted list. There should be an opening paragraph explaining what you are doing. Then each ratio should have its own paragraph where you discuss the values for the three firms as well as explain the results. There should be a concluding paragraph summing up your assessment. You must discuss the results and show me that you understand them. 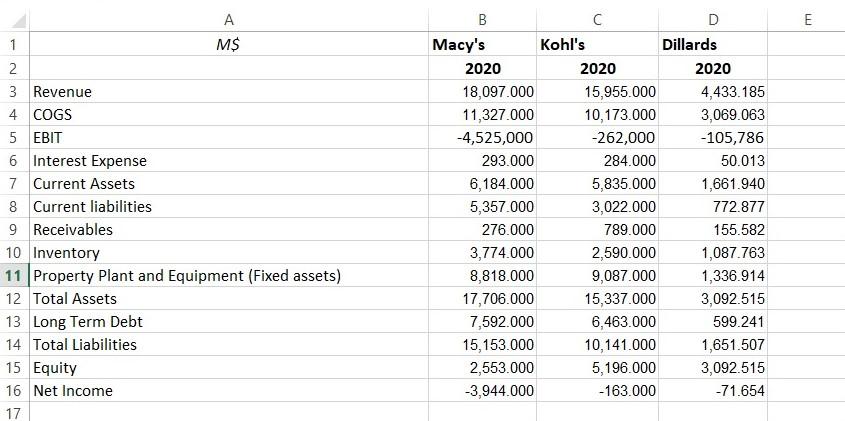
LI E A 1 M$ 2 3 Revenue 4 COGS 5 EBIT 6 Interest Expense 7 Current Assets 8 Current liabilities 9 Receivables 10 Inventory 11 Property Plant and Equipment (Fixed assets) 12 Total Assets 13 Long Term Debt 14 Total Liabilities 15 Equity 16 Net Income 17 B D Macy's Kohl's Dillards 2020 2020 2020 18,097.000 15,955.000 4,433.185 11,327.000 10,173.000 3,069.063 -4,525,000 -262,000 -105,786 293.000 284.000 50.013 6,184.000 5,835.000 1,661.940 5,357.000 3,022.000 772.877 276.000 789.000 155.582 3,774.000 2,590.000 1,087.763 8,818.000 9,087.000 1,336.914 17,706.000 15,337.000 3,092.515 7,592.000 6,463.000 599.241 15,153.000 10,141.000 1,651.507 2,553.000 5,196.000 3,092.515 -3,944.000 -163.000 -71.654 LI E A 1 M$ 2 3 Revenue 4 COGS 5 EBIT 6 Interest Expense 7 Current Assets 8 Current liabilities 9 Receivables 10 Inventory 11 Property Plant and Equipment (Fixed assets) 12 Total Assets 13 Long Term Debt 14 Total Liabilities 15 Equity 16 Net Income 17 B D Macy's Kohl's Dillards 2020 2020 2020 18,097.000 15,955.000 4,433.185 11,327.000 10,173.000 3,069.063 -4,525,000 -262,000 -105,786 293.000 284.000 50.013 6,184.000 5,835.000 1,661.940 5,357.000 3,022.000 772.877 276.000 789.000 155.582 3,774.000 2,590.000 1,087.763 8,818.000 9,087.000 1,336.914 17,706.000 15,337.000 3,092.515 7,592.000 6,463.000 599.241 15,153.000 10,141.000 1,651.507 2,553.000 5,196.000 3,092.515 -3,944.000 -163.000 -71.654
Step by Step Solution
There are 3 Steps involved in it

Get step-by-step solutions from verified subject matter experts