

Question: Use the excel spreadsheet to answer questions questions: 1. Cause of change analysis on the income statement comparing the years 2002-2003 2003-2004 2004-2005 2005-2006 2.
Use the excel spreadsheet to answer questions
questions: 1. Cause of change analysis on the income statement comparing the years
2002-2003
2003-2004
2004-2005
2005-2006
2. Common size and trend statements
creat a common size income statement for each year
create a trend statement for the income statement with 2002 as base year
create a common size balance sheet for each year
create a trend statement for the balance sheet with 2002 as base year
create a common size statement of cash flows with each line item as a percentage of sales
create A trend statement for the statement of cash flows with 2003 as the base year
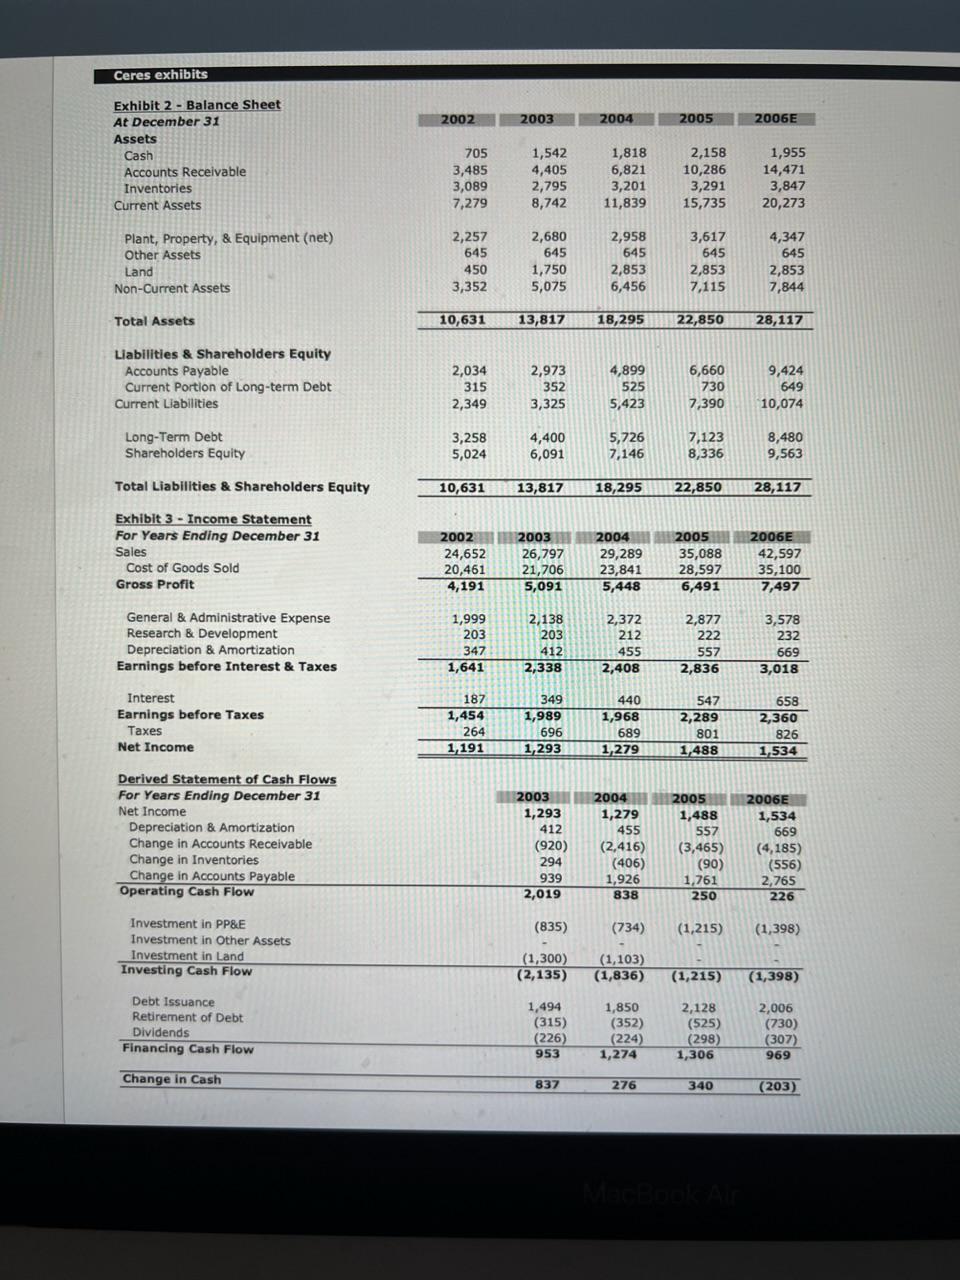
Ceres exhibits Exhibit 2 - Balance Sheet At December 31 Assets Accounts Receivable Inventories Current Assets Plant, Property, \& Equipment (net) Other Assets Land Non-Current Assets Total Assets \begin{tabular}{r|r|r|r|r|} \hline 2002 & 2003 & 2004 & \multicolumn{1}{|c|}{2005} & \multicolumn{1}{|c|}{ 2006E } \\ \hline 705 & 1,542 & 1,818 & 2,158 & 1,955 \\ 3,485 & 4,405 & 6,821 & 10,286 & 14,471 \\ 3,089 & 2,795 & 3,201 & 3,291 & 3,847 \\ 7,279 & 8,742 & 11,839 & 15,735 & 20,273 \\ & & & & \\ 2,257 & 2,680 & 2,958 & 3,617 & 4,347 \\ 645 & 645 & 645 & 645 & 645 \\ 450 & 1,750 & 2,853 & 2,853 & 2,853 \\ 3,352 & 5,075 & 6,456 & 7,115 & 7,844 \\ & & & & \\ \hline 10,631 & 13,817 & 18,295 & 22,850 & 28,117 \\ \hline \end{tabular} Liabilities \& Shareholders Equity Accounts Payable Current Portion of Long-term Debt Current Liabilities Long-Term Debt Shareholders Equity Total Liabilities \& Shareholders Equity \begin{tabular}{rr|rrr} 2,034 & 2,973 & 4,899 & 6,660 & 9,424 \\ 315 & 352 & 525 & 730 & 649 \\ 2,349 & 3,325 & 5,423 & 7,390 & 10,074 \\ & & & & \\ 3,258 & 4,400 & 5,726 & 7,123 & 8,480 \\ 5,024 & 6,091 & 7,146 & 8,336 & 9,563 \\ \hline 10,631 & 13,817 & 18,295 & 22,850 & 28,117 \\ \hline \end{tabular} Exhibit 3 - Income Statement For Years Ending December 31 Sales Cost of Goods Sold Gross Profit General \&. Administrative Expense Research \& Development Depreciation 8 Amortization Earnings before Interest 8 Taxes \begin{tabular}{r|r|r|r|r|} \hline 2002 & 2003 & 2004 & 2005 & 2006E \\ \hline 24,652 & 26,797 & 29,289 & 35,088 & 42,597 \\ 20,461 & 21,706 & 23,841 & 28,597 & 35,100 \\ \hline 4,191 & 5,091 & 5,448 & 6,491 & 7,497 \\ & & & & \\ 1,999 & 2,138 & 2,372 & 2,877 & 3,578 \\ 203 & 203 & 212 & 222 & 232 \\ 347 & 412 & 455 & 557 & 669 \\ \hline 1,641 & 2,338 & 2,408 & 2,836 & 3,018 \\ 187 & 349 & 440 & 547 & 658 \\ \hline 1,454 & 1,989 & 1,968 & 2,289 & 2,360 \\ 264 & 696 & 689 & 801 & 826 \\ \hline 1,191 & 1,293 & 1,279 & 1,488 & 1,534 \\ \hline \hline \end{tabular} Derived Statement of Cash Flows For Years Ending December 31 Net Income \begin{tabular}{l|r|r|r|r||} Net Income & 1,293 & 1,279 & 1,488 & 1,534 \\ Depreciation \& Amortization & 412 & 455 & 557 & 669 \\ Change in Accounts Receivable & (920) & (2,416) & (3,465) & (4,185) \\ Change in Inventories & 294 & (406) & (90) & (556) \\ Change in Accounts Payable & 939 & 1,926 & 1,761 & 2,765 \\ \hline Operating Cash Flow & 2,019 & 838 & 250 & 226 \end{tabular} Investment in PP\&E (835) (734) (1,215)(1,398) Investment in Other Assets \begin{tabular}{lrrrr} Investment in Land & (1,300) & (1,103) & \\ \hline Investing Cash Flow & (2,135) & (1,836) & (1,215) & (1,398) \\ & & & & \\ Debt Issuance & 1,494 & 1,850 & 2,128 & 2,006 \\ Retirement of Debt & (315) & (352) & (525) & (730) \\ Dividends & (226) & (224) & (298) & (307) \\ \hline Financing Cash Flow & 953 & 1,274 & 1,306 & 969 \\ \hline Change in Cash & & 837 & 276 & 340 \\ \hline \end{tabular} Ceres exhibits Exhibit 2 - Balance Sheet At December 31 Assets Accounts Receivable Inventories Current Assets Plant, Property, \& Equipment (net) Other Assets Land Non-Current Assets Total Assets \begin{tabular}{r|r|r|r|r|} \hline 2002 & 2003 & 2004 & \multicolumn{1}{|c|}{2005} & \multicolumn{1}{|c|}{ 2006E } \\ \hline 705 & 1,542 & 1,818 & 2,158 & 1,955 \\ 3,485 & 4,405 & 6,821 & 10,286 & 14,471 \\ 3,089 & 2,795 & 3,201 & 3,291 & 3,847 \\ 7,279 & 8,742 & 11,839 & 15,735 & 20,273 \\ & & & & \\ 2,257 & 2,680 & 2,958 & 3,617 & 4,347 \\ 645 & 645 & 645 & 645 & 645 \\ 450 & 1,750 & 2,853 & 2,853 & 2,853 \\ 3,352 & 5,075 & 6,456 & 7,115 & 7,844 \\ & & & & \\ \hline 10,631 & 13,817 & 18,295 & 22,850 & 28,117 \\ \hline \end{tabular} Liabilities \& Shareholders Equity Accounts Payable Current Portion of Long-term Debt Current Liabilities Long-Term Debt Shareholders Equity Total Liabilities \& Shareholders Equity \begin{tabular}{rr|rrr} 2,034 & 2,973 & 4,899 & 6,660 & 9,424 \\ 315 & 352 & 525 & 730 & 649 \\ 2,349 & 3,325 & 5,423 & 7,390 & 10,074 \\ & & & & \\ 3,258 & 4,400 & 5,726 & 7,123 & 8,480 \\ 5,024 & 6,091 & 7,146 & 8,336 & 9,563 \\ \hline 10,631 & 13,817 & 18,295 & 22,850 & 28,117 \\ \hline \end{tabular} Exhibit 3 - Income Statement For Years Ending December 31 Sales Cost of Goods Sold Gross Profit General \&. Administrative Expense Research \& Development Depreciation 8 Amortization Earnings before Interest 8 Taxes \begin{tabular}{r|r|r|r|r|} \hline 2002 & 2003 & 2004 & 2005 & 2006E \\ \hline 24,652 & 26,797 & 29,289 & 35,088 & 42,597 \\ 20,461 & 21,706 & 23,841 & 28,597 & 35,100 \\ \hline 4,191 & 5,091 & 5,448 & 6,491 & 7,497 \\ & & & & \\ 1,999 & 2,138 & 2,372 & 2,877 & 3,578 \\ 203 & 203 & 212 & 222 & 232 \\ 347 & 412 & 455 & 557 & 669 \\ \hline 1,641 & 2,338 & 2,408 & 2,836 & 3,018 \\ 187 & 349 & 440 & 547 & 658 \\ \hline 1,454 & 1,989 & 1,968 & 2,289 & 2,360 \\ 264 & 696 & 689 & 801 & 826 \\ \hline 1,191 & 1,293 & 1,279 & 1,488 & 1,534 \\ \hline \hline \end{tabular} Derived Statement of Cash Flows For Years Ending December 31 Net Income \begin{tabular}{l|r|r|r|r||} Net Income & 1,293 & 1,279 & 1,488 & 1,534 \\ Depreciation \& Amortization & 412 & 455 & 557 & 669 \\ Change in Accounts Receivable & (920) & (2,416) & (3,465) & (4,185) \\ Change in Inventories & 294 & (406) & (90) & (556) \\ Change in Accounts Payable & 939 & 1,926 & 1,761 & 2,765 \\ \hline Operating Cash Flow & 2,019 & 838 & 250 & 226 \end{tabular} Investment in PP\&E (835) (734) (1,215)(1,398) Investment in Other Assets \begin{tabular}{lrrrr} Investment in Land & (1,300) & (1,103) & \\ \hline Investing Cash Flow & (2,135) & (1,836) & (1,215) & (1,398) \\ & & & & \\ Debt Issuance & 1,494 & 1,850 & 2,128 & 2,006 \\ Retirement of Debt & (315) & (352) & (525) & (730) \\ Dividends & (226) & (224) & (298) & (307) \\ \hline Financing Cash Flow & 953 & 1,274 & 1,306 & 969 \\ \hline Change in Cash & & 837 & 276 & 340 \\ \hline \end{tabular}
Step by Step Solution
There are 3 Steps involved in it

Get step-by-step solutions from verified subject matter experts