

Question: Use the figure below to answer the following question. $5 2 S: Si o 2 4 6 8 10 12 14 16 18 20
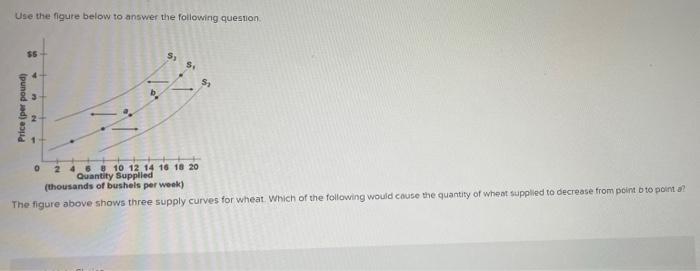
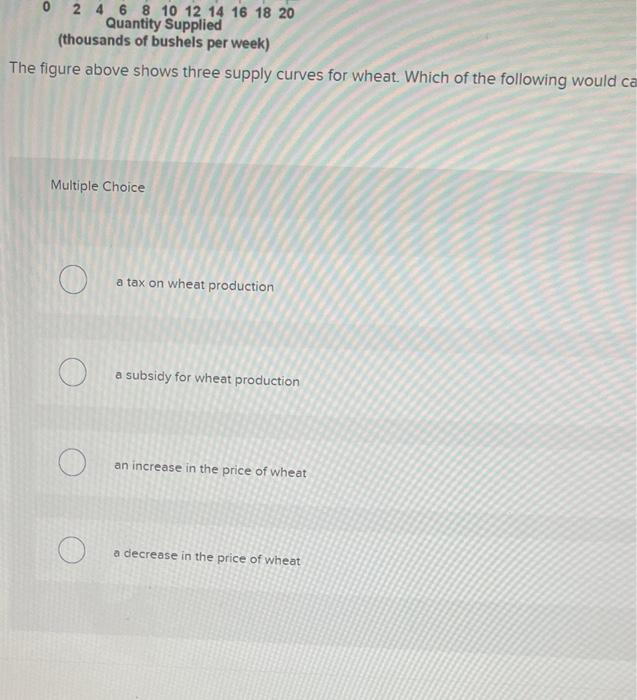
Use the figure below to answer the following question. $5 2 S: Si o 2 4 6 8 10 12 14 16 18 20 Quantity Supplied (thousands of bushels per week) The figure above shows three supply curves for wheat. Which of the following would cause the quantity of wheat supplied to decrease from point b to point a?
Step by Step Solution
There are 3 Steps involved in it
1 Expert Approved Answer
Step: 1 Unlock

Question Has Been Solved by an Expert!
Get step-by-step solutions from verified subject matter experts
Step: 2 Unlock
Step: 3 Unlock