

Question: use the figure to determine whether there has been a change in the mean concentration level of cyanide for each time period. Explain. a) from
- use the figure to determine whether there has been a change in the mean concentration level of cyanide for each time period. Explain. a) from year 1 to year 2 b) from year 2 to 3 c) from year 1 to 3
- using the results of excersise 1, what can you conclude about the concentrations of cyanide in the drinking water?
- the confidence interval for year 2 is much larger than the other years. What do you think may have caused this larger confidence level?
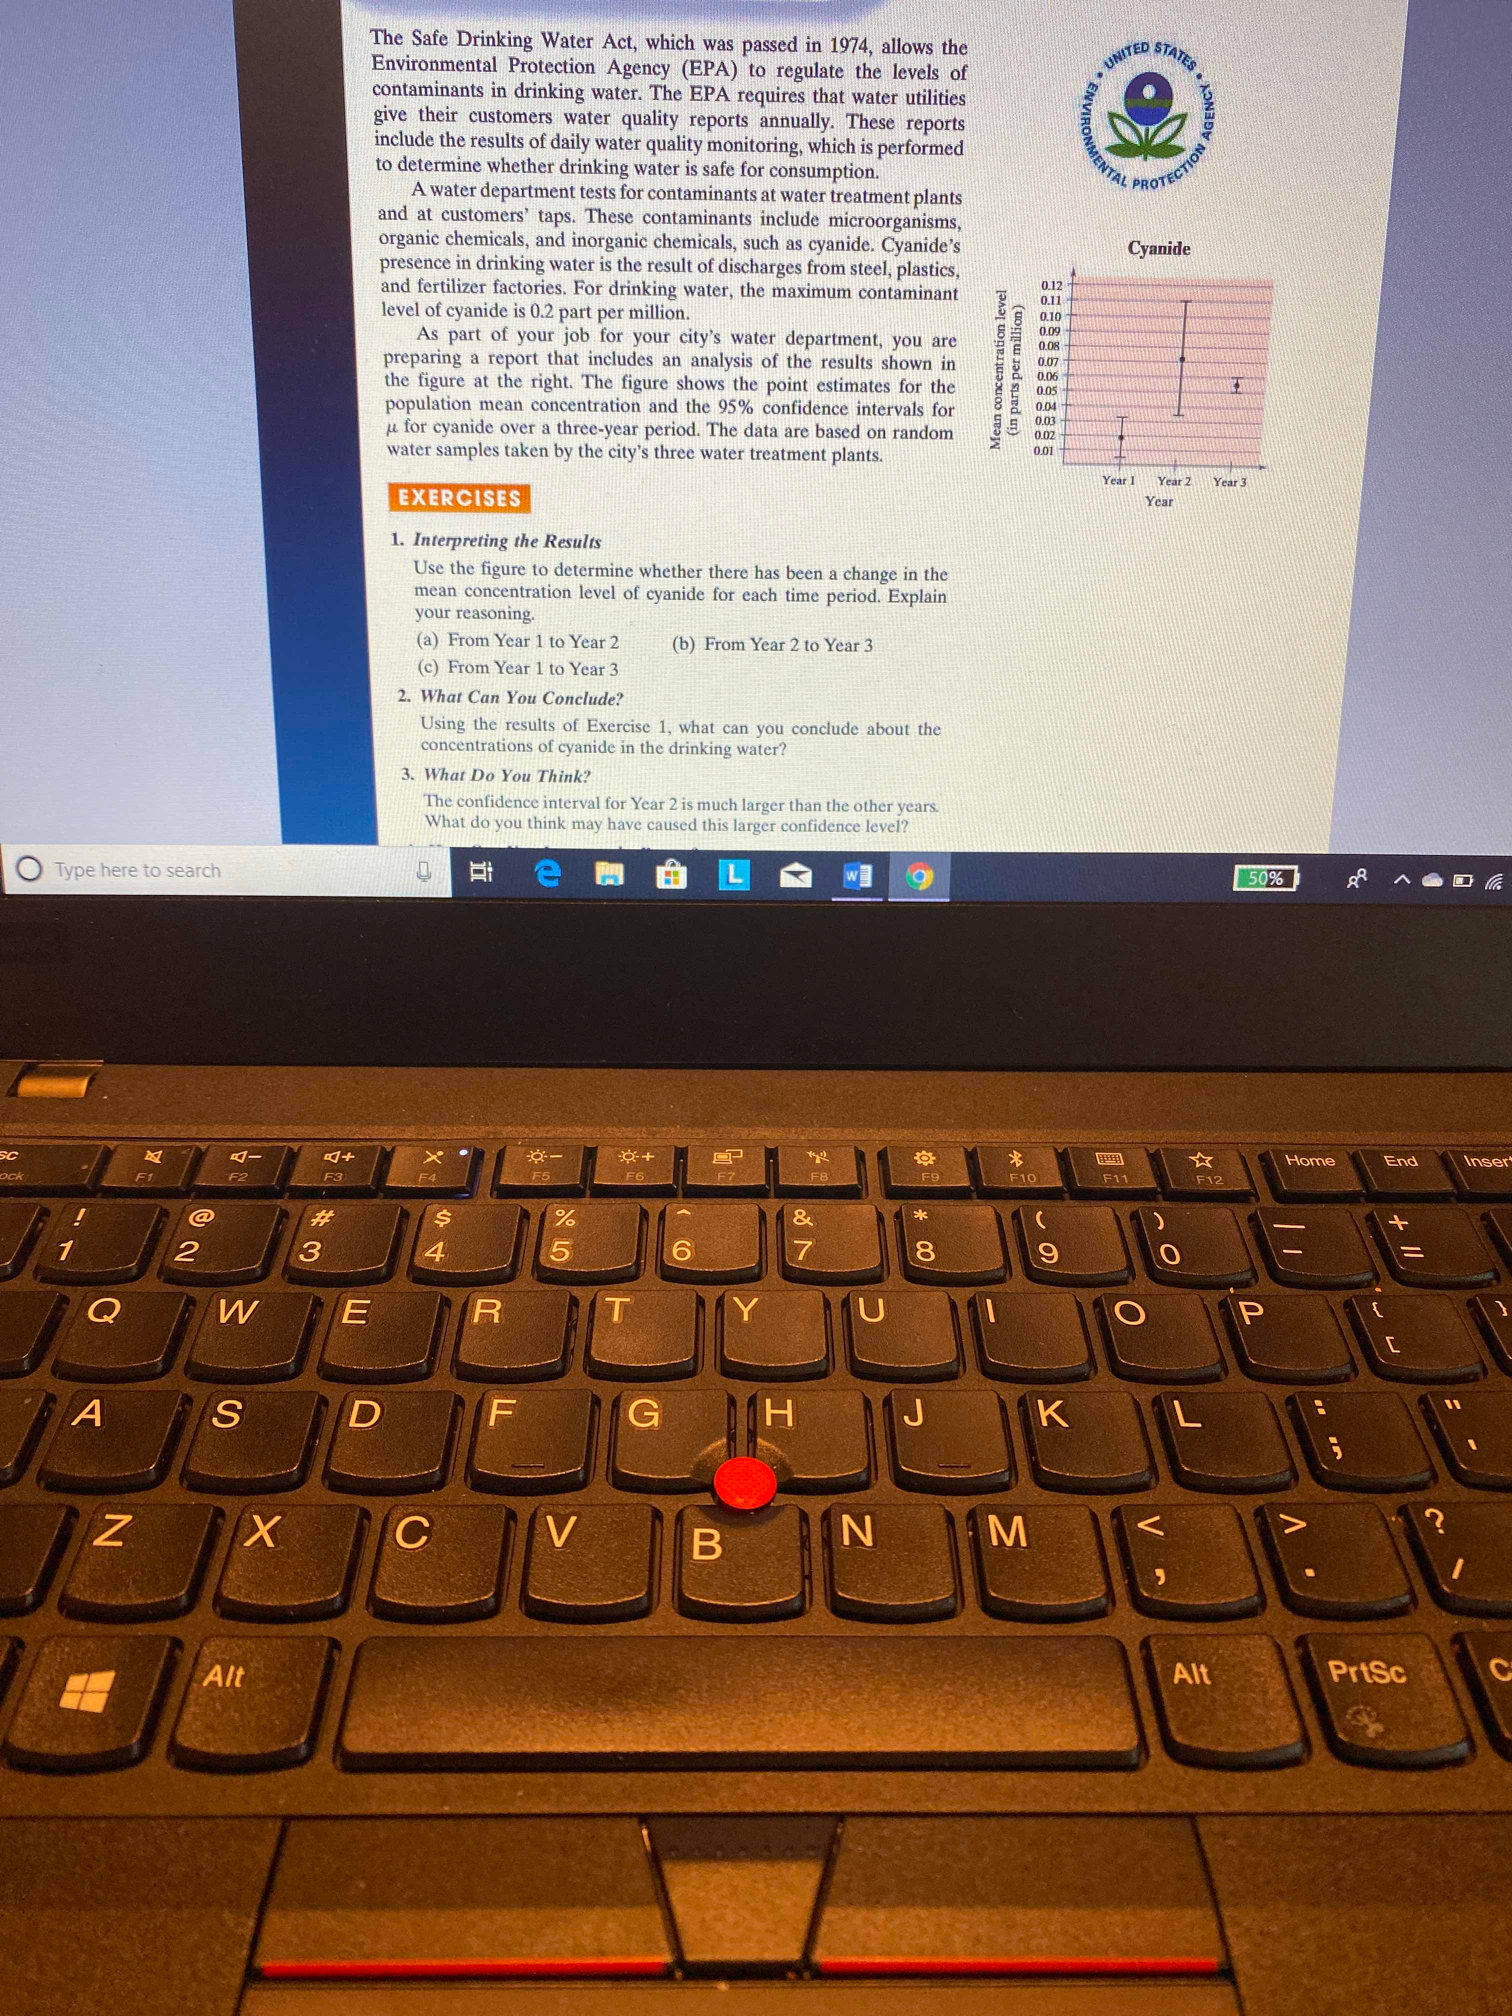
The Safe Drinking Water Ash-which was passed in 1974, allows th _ Environmental Protection Agency (EPA) to Z regulate the levels of contaminants in drinking water. The EPA requires that water utili es' ' ' give their customers water quality reports annually. These reports include the results of daily water quality monitoring. whichis performed to determine whether drinking water is safe for consumption. Awater department tests for contaminants at water treatment plants and at customers' taps. 111ese contaminants include microorganisms, organic chemicals, and inorganic chemicals. such as cyanide. Cyanide's presence in drinking water is the result of discharges from steel. plastics, and fertilizer factories. For drinking water, the maximum contaminant level of cyanide is 0.2 part per million. As part of your job for your city's water department. you are preparing a report that includes an analysis of the results shown in the figure at the right. The figure shows the point estimates for the population mean concentration and the 95% condence intervals for ii. for cyanide over a three-year period. The data are based on random water samples taken by the city's three water treatment plants. Year] Year: Year: You Mean concentration lewd (in put: permitlim) l. Interpreting the Results Use the gure to determine whether there has been a change in the mean concentration level of cyanide for each time period. Explain your reasoning. (a) From Year 1 to Year '2 (c) From Year 1 to Year 3 1. What Cm: You Condo-dc? (is) From Year 2 to Year 3 Using the results of Exercise 1. what can you conclude about the concentrations of cyanide in the drinking water'? 3. What Do You Think? the confidence interval for Year 2. is much larger than the other years What do you think may hai- 0 Type here to search used this larger confidence level? Horns
Step by Step Solution
There are 3 Steps involved in it

Get step-by-step solutions from verified subject matter experts