

Question: Use the FLORIDA COUNTIES boxplot above to answer the questions below.To help you read the boxplot correctly, know that the lower tail is at 10,000
Use the FLORIDA COUNTIES boxplot above to answer the questions below.To help you read the boxplot correctly, know that the lower tail is at 10,000 persons and the outlier is at 920,000 persons.+ What is the shape of the distribution? right-skewed+ This shape tells us that many counties had lower populations and only a few had very high populations .+ Which would be a better measure of center for the county populations, the mean or the median, and why? [ Select ]+ Which would be a better measure of spread for the county populations, the range or the interquartile range, and why? The interquartile range, because there are quartiles in the data set.+ We can expect the mean county population to be greater than 70 thousand persons.+ What percent of counties had populations that were less than the mean? [ Select ]+ The percentage of counties where the population is less than 70 thousand persons is [ Select ] the percentage of counties where the population is greater than 70 thousand persons.+ What percent of counties had populations that were between 20 and 280 thousand persons? [ Select ]+ What percent of counties had populations that were between 280 and 920 thousand persons? [ Select ]+ Of the following data ranges (in thousands of persons), which one had the densest distribution of county populations (most concentrated data)? [ Select ]+ Of the following data ranges (in thousands of persons), which one had the least dense distribution of county populations (least concentrated data)?Use the FLORIDA COUNTIES boxplot above to answer the questions below.Please enter your answers in the following way: if an answer is "30,000 persons", just enter "30".+ Write down the five-number summary of the data. thousand persons thousand persons thousand persons thousand persons thousand persons+ What is the lowest value that is not an outlier? thousand persons+ What is the highest value that is not an outlier? thousand persons+ What is the range of the data? thousand persons+ What is the interquartile range of the data? thousand persons+ What is the range if the outliers are excluded? thousand persons
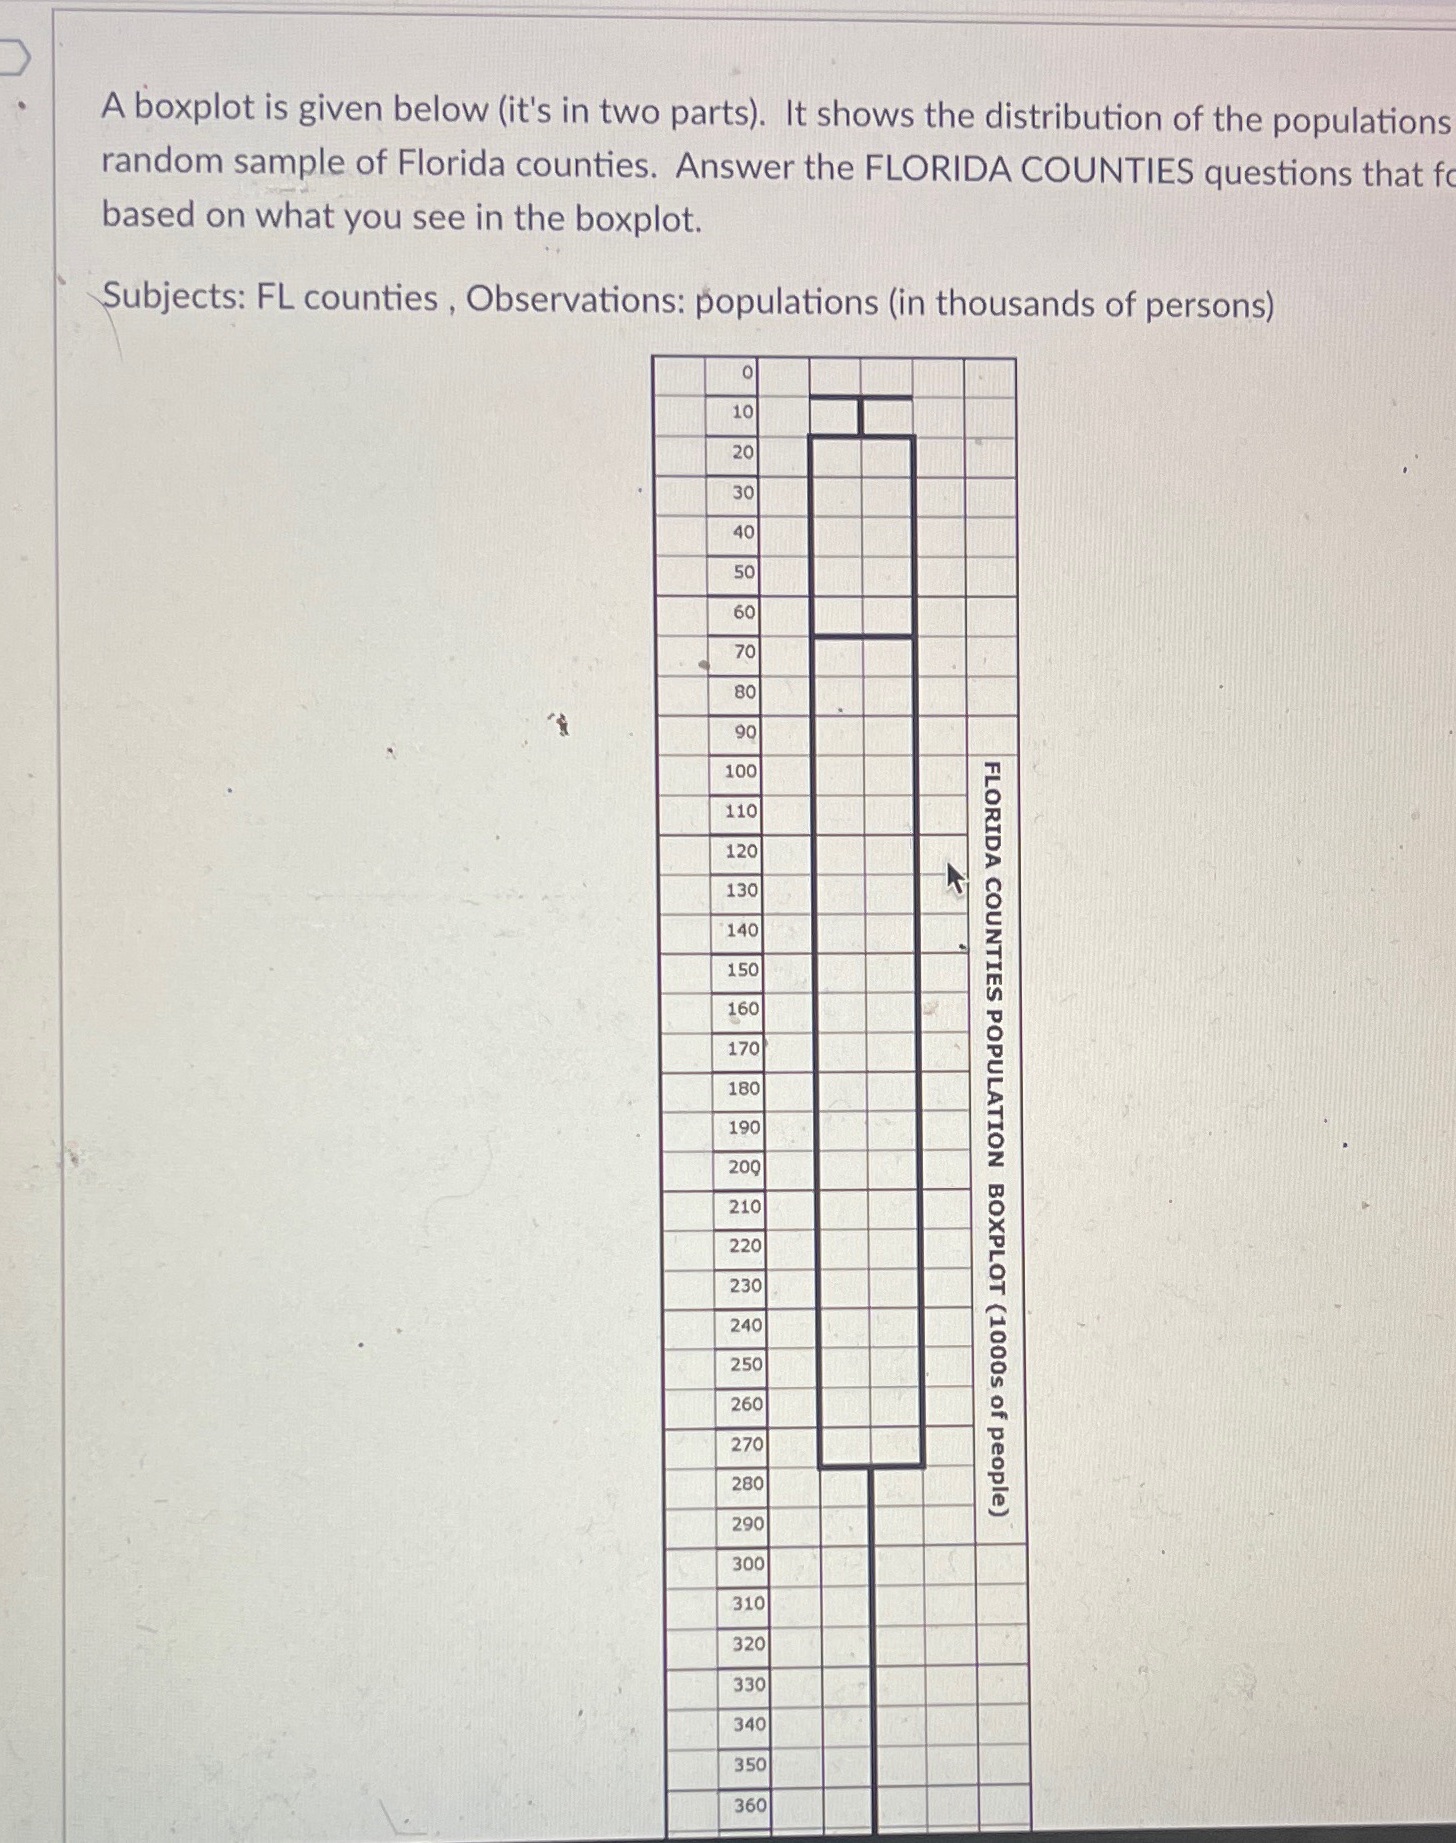
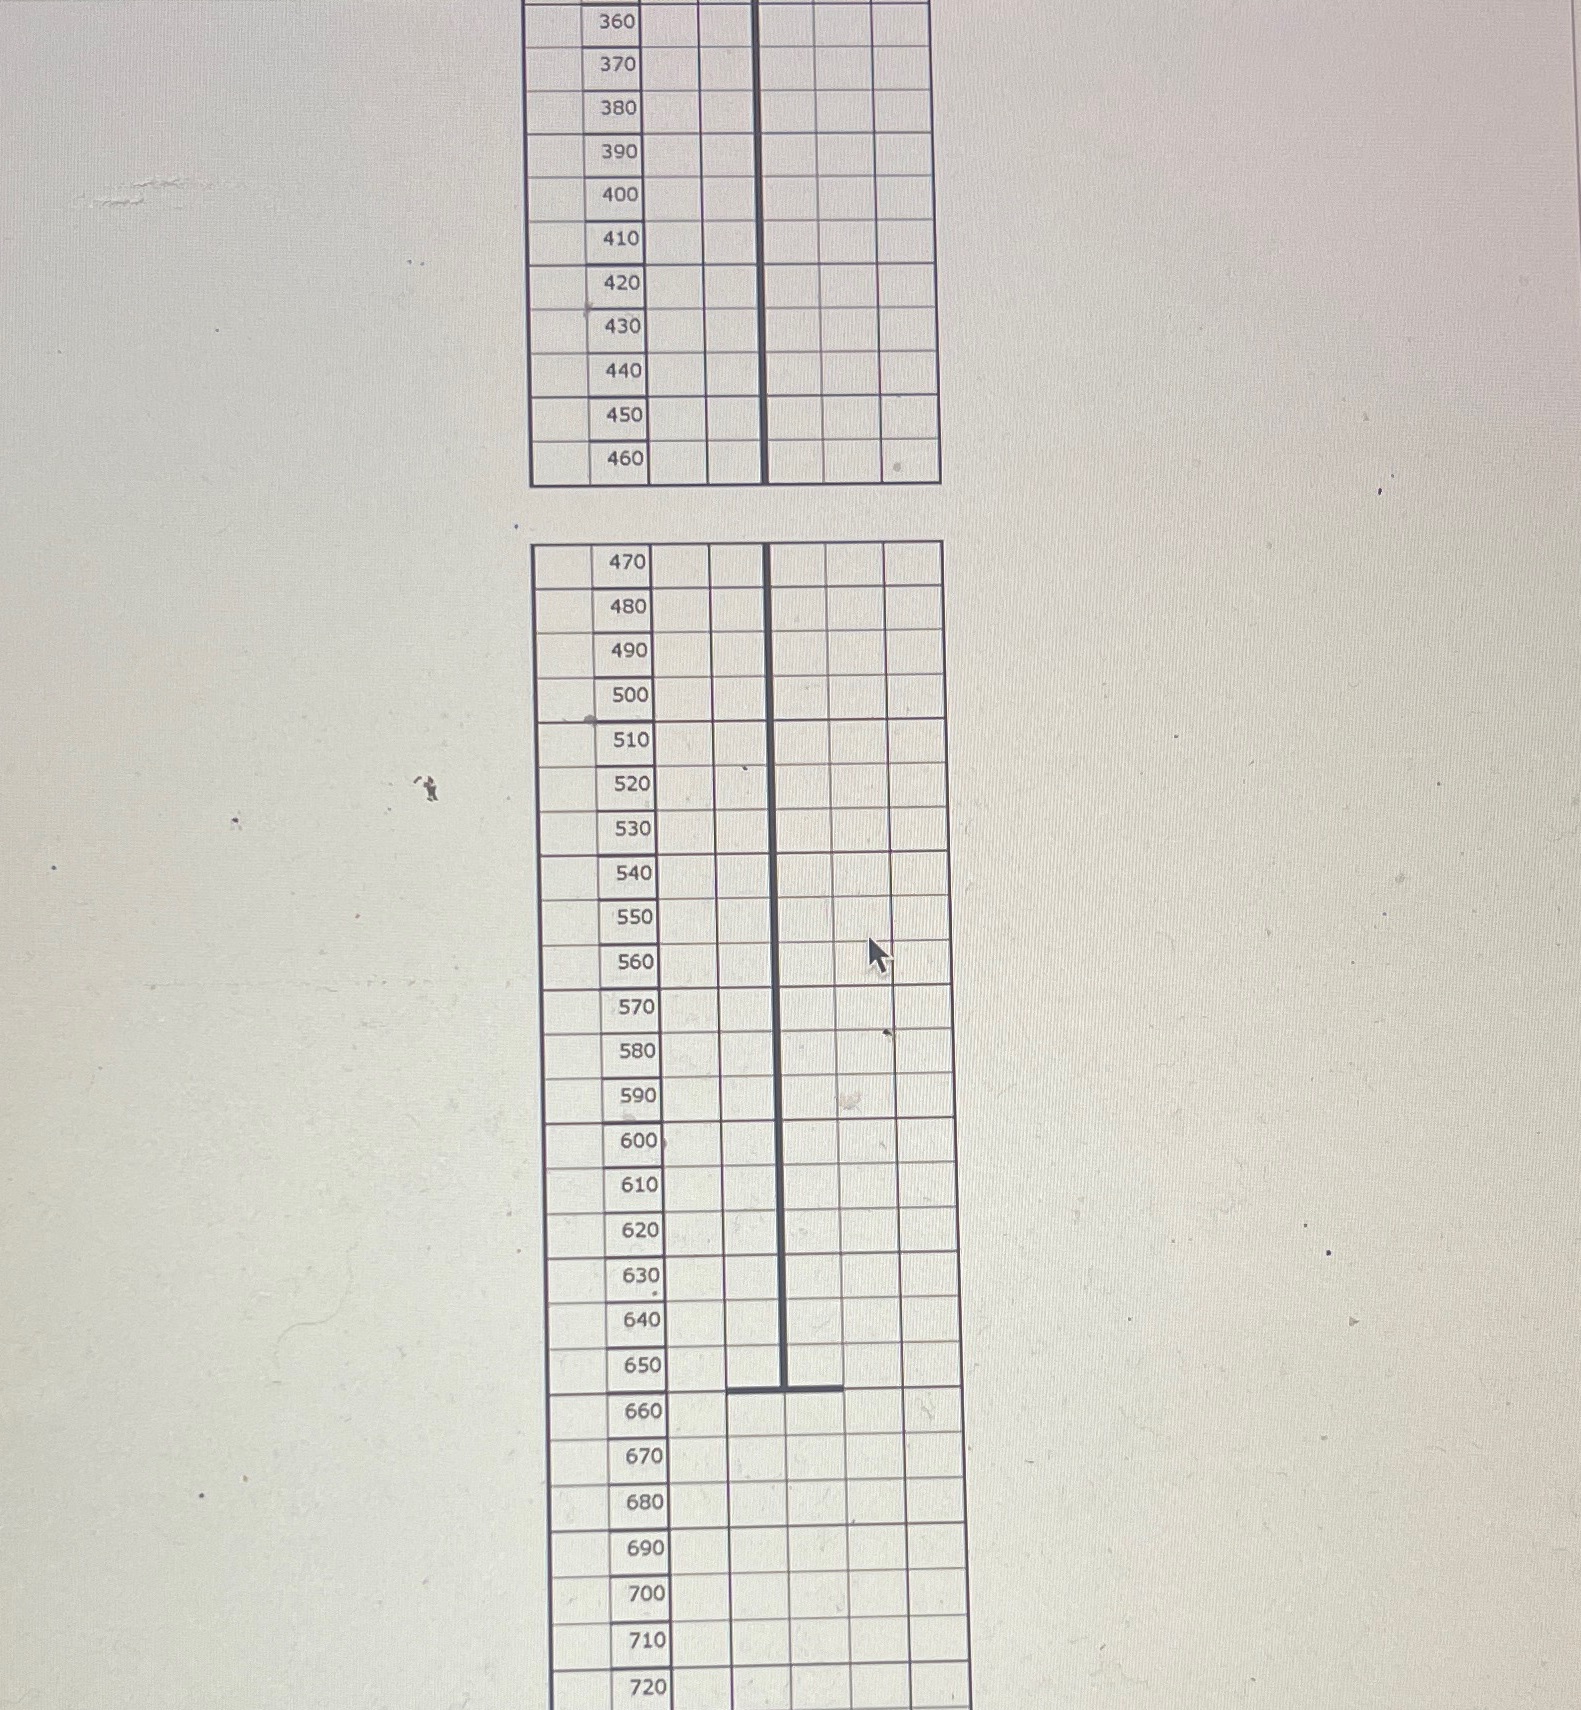
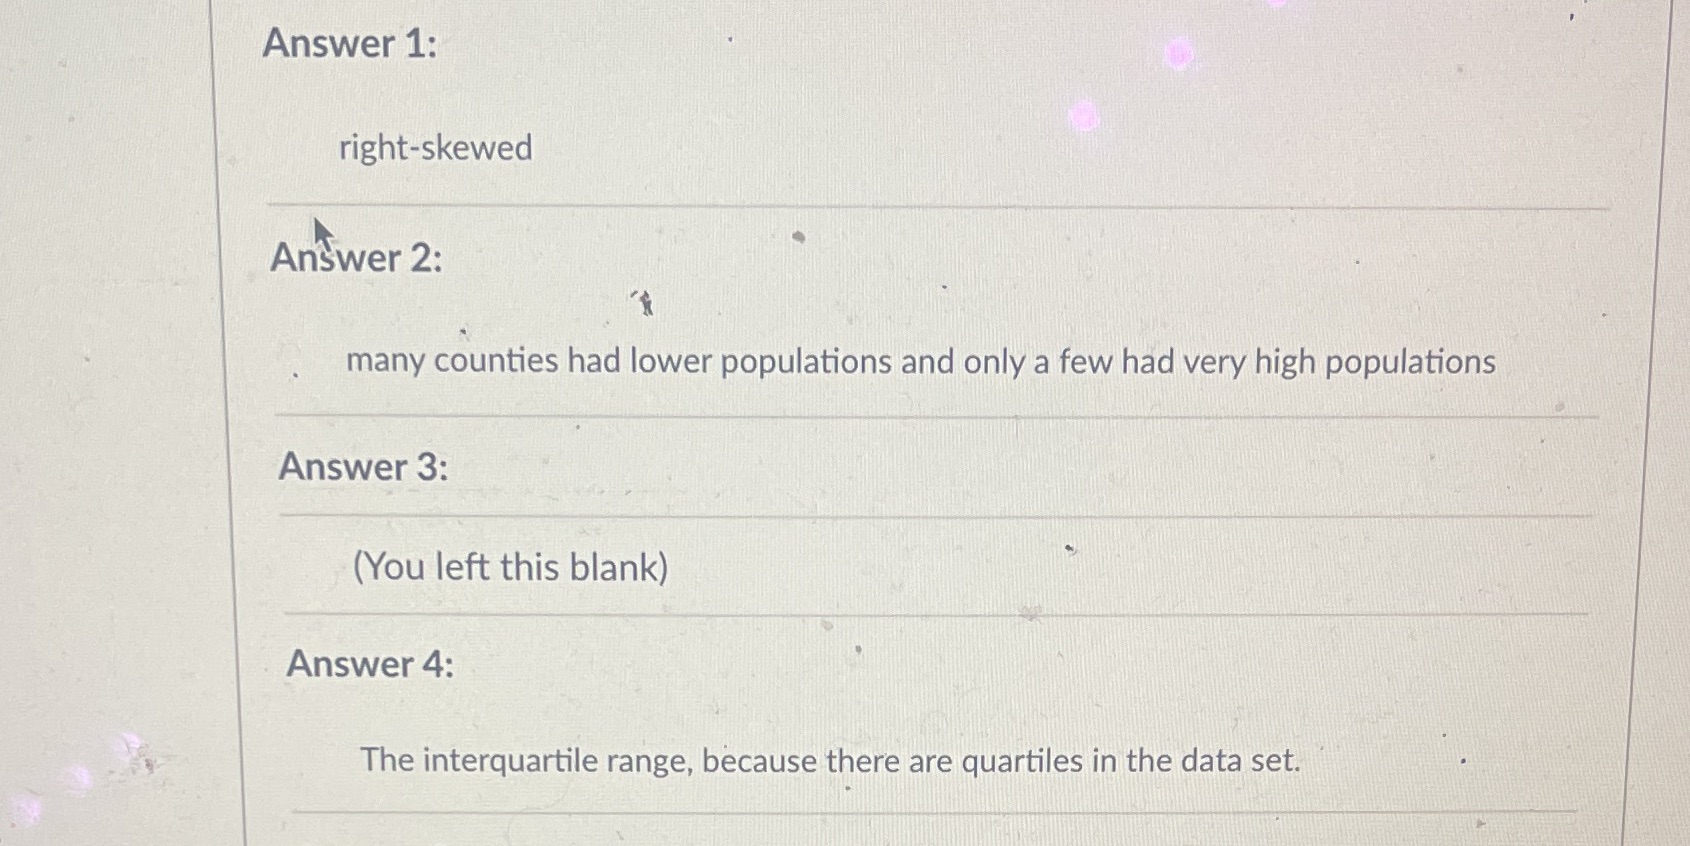
A boxplot is given below (it's in two parts). It shows the distribution of the populations random sample of Florida counties. Answer the FLORIDA COUNTIES questions that fc based on what you see in the boxplot. Subjects: FL counties , Observations: populations (in thousands of persons) 360 370 380 390 400 410 420 430 440 450 460 470 480 490 500 510 520 530 540 550 560 570 580 590 600 610 620 630 640 650 660 670 680 690 700 710 720Answer 1: right-skewed Answer 2: many counties had lower populations and only a few had very high populations Answer 3: (You left this blank) Answer 4: The interquartile range, because there are quartiles in the data set
Step by Step Solution
There are 3 Steps involved in it

Get step-by-step solutions from verified subject matter experts