

Question: Use the following comparative figures for Apple and Google. Key Figures Net income (in millions) Cash dividends declared per common share Common shares outstanding
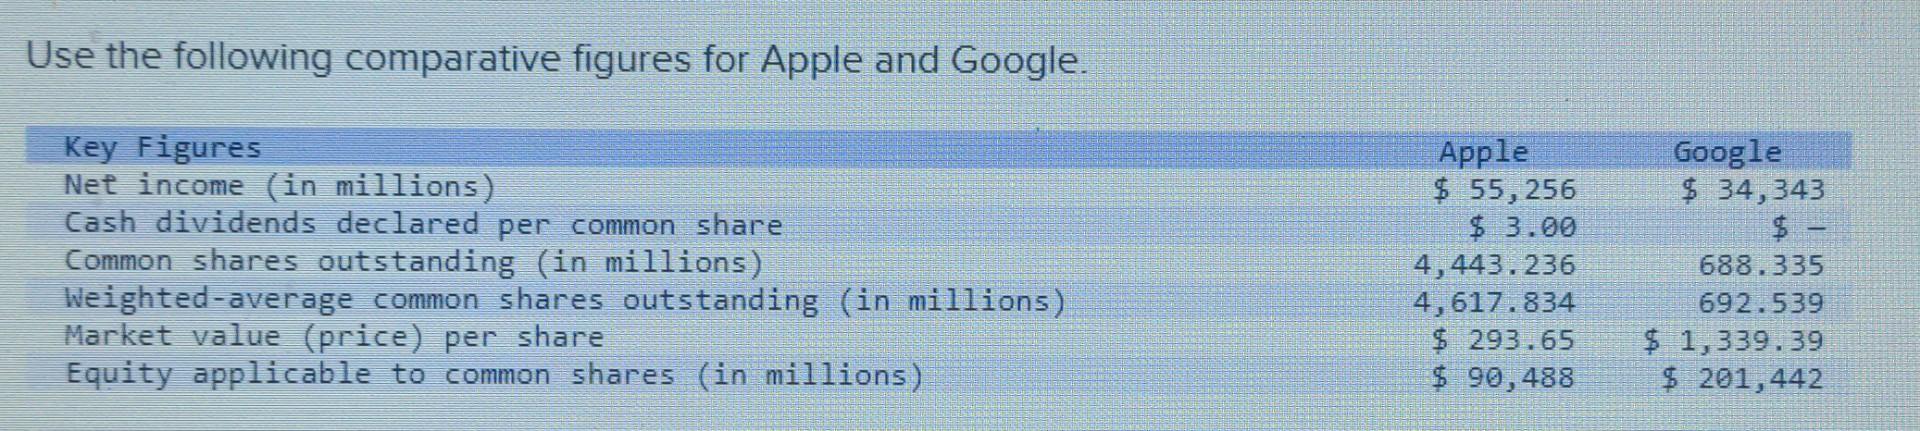


Use the following comparative figures for Apple and Google. Key Figures Net income (in millions) Cash dividends declared per common share Common shares outstanding (in millions) Weighted-average common shares outstanding (in millions) Market value (price) per share Equity applicable to common shares (in millions) Apple $ 55,256 $ 3.00 4,443.236 4,617.834 $ 293.65 $ 90,488 Google $ 34,343 $ = 688.335 692.539 $ 1,339.39 $ 201,442
Step by Step Solution
There are 3 Steps involved in it
1 Expert Approved Answer
Step: 1 Unlock

Question Has Been Solved by an Expert!
Get step-by-step solutions from verified subject matter experts
Step: 2 Unlock
Step: 3 Unlock