Question: Use the following data for Questions 35 - 37. a). The Older Than Dirt potting soil company uses a machine to fill 500-ounce bags of
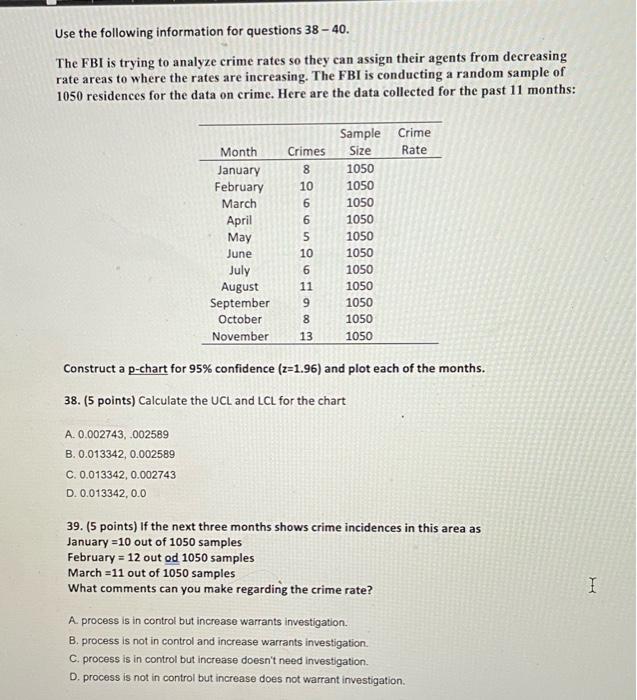
Use the following data for Questions 35 - 37. a). The Older Than Dirt potting soil company uses a machine to fill 500-ounce bags of enriched potting soil with a standard deviation of 4 oz. The industry group has set limits on what can be called a 500-ounce bag: a 500-ounce bag of dirt must weigh at least 486 ounces and not more than 514 ounces. The company wants to operate its process at a minimum process capability of 1.10. a 35. (2 points) Calculate the Cp, and evaluate the process capability of scenario a). A. 1.167, process not capable of meeting the variability B. 1.167, process is capable of meeting the variability C..987, process not capable of meeting the variability D..987. process capable of meeting the variability b). Suppose that the company is now operating the process with a mean of 504 ounces and a standard deviation () of 4 ounces. Is the company currently capable of meeting the industry group's specification standards if the company's minimum Suk is 1.10? 36. (2 points) Calculate the Cex, and evaluate the process capability of scenario b). A. 0.833, process not capable of meeting the customer's requirements. B. 1.50, process is capable of meeting the customer's requirements. C. 0.833, process is capable of meeting the customer's requirements. D. 1.5, process is not capable of meeting the customer's requirements. 37.2 points) Considering the two scenarios above, what conclusion can be drawn: I D. 1.5, process is not capable of meeting the customer's requirements. 37.(2 points) Considering the two scenarios above, what conclusion can be drawn: A. variability is acceptable, but the mean is centered. B. variability is not acceptable, and the mean has drifted to much and needs to be centered C. variability is not acceptable, and the mean is centered.. D. variability is acceptable, but the mean has drifted to much and needs to be centered. Use the following information for questions 38 - 40. The FBI is trying to analyze crime rates so they can assign their agents from decreasing rate areas to where the rates are increasing. The FBI is conducting a random sample of 1050 residences for the data on crime. Here are the data collected for the past 11 months: Month January February March April May June July August September October November Crimes 8 10 6 6 5 10 6 11 9 8 13 Sample Crime Size Rate 1050 1050 1050 1050 1050 1050 1050 1050 1050 1050 1050 Construct a p-chart for 95% confidence (z=1.96) and plot each of the months. 38. (5 points) Calculate the UCL and LCL for the chart A. 0.002743, .002589 B. 0.013342, 0.002589 C. 0.013342, 0.002743 D. 0.013342, 0.0 39. (5 points) If the next three months shows crime incidences in this area as January =10 out of 1050 samples February = 12 out od 1050 samples March =11 out of 1050 samples What comments can you make regarding the crime rate? I A. process is in control but increase warrants investigation. B. process is not in control and increase warrants investigation C. process is in control but increase doesn't need investigation D. process is not in control but increase does not warrant investigation