

Question: Use the following data to explore the risk-return relation and the concept of beta for Apple stock, Kroger stock, and the S&P 500 market index:
Use the following data to explore the risk-return relation and the concept of beta for Apple stock, Kroger stock, and the S&P 500 market index:
Year | Apple Stock Price | Kroger Stock Price | S&P 500 Market Index |
2020 | $252.92 | $30.71 | 3,234.85 |
2019 | $156.23 | $27.66 | 2,531.94 |
2018 | $169.23 | $27.32 | 2,753.15 |
2017 | $125.17 | $29.52 | 2,276.98 |
2016 | $108.41 | $31.80 | 2,043.94 |
2015 | $112.98 | $33.37 | 2,058.20 |
Part 1: Risk and Beta
- Calculate the return each year for Apple, Kroger, and the Market using the equation:
Return = (Value this year – Value last year) / Value last year. In addition, use the Excel function “Average” to find the average of the returns.
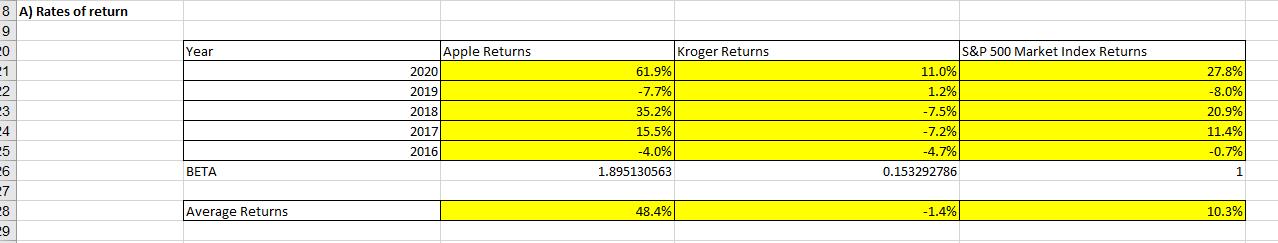
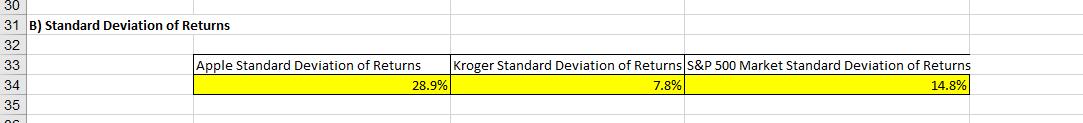
- Calculate the standard deviation of rates of return for Apple, Kroger, and the Market using the “Stdev” Excel function.
- HOW DO YOU DO THIS?? Make a scatter plot of stock returns (y-axis) against market returns (x-axis) for both Apple and Kroger stock in one plot. Add a linear trend line to the scatter plot for each stock and include the equation on the chart (Select data point and right click then select "add trendline" and choose a "linear" trend and select "display equation on chart"). Label the y-axis, x-axis, legend, and chart title.
- CAN YOU HELP?? For each stock, use the Excel function “Correl” to calculate the correlation between the stock returns and market returns. Furthermore, copy the standard deviations from above (by cell reference) and calculate the beta according to the equation: Beta = (Standard deviation of stock / Standard deviation of market) (Correlation between stock and market).

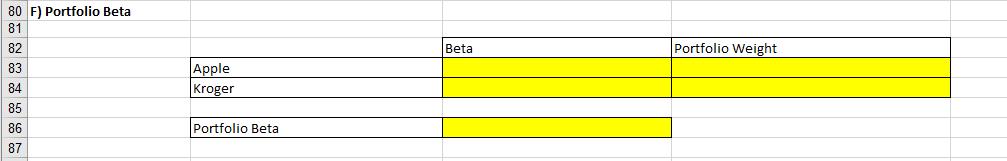
F.If you formed a portfolio that consisted of 60% Apple stock and 40% Kroger stock, calculate the beta.
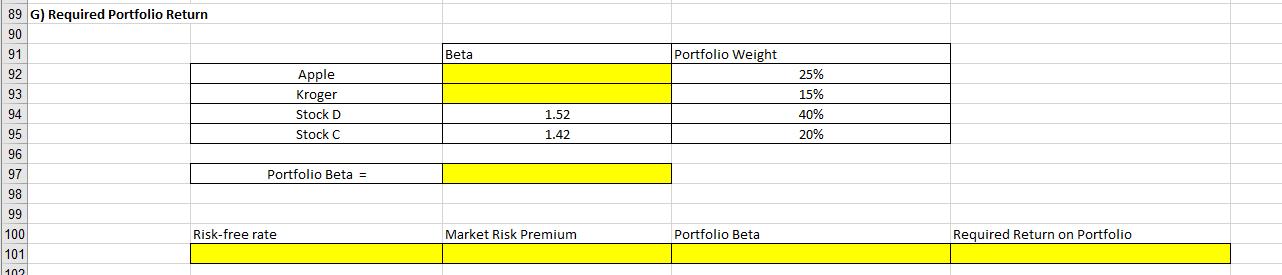
G. . Calculate the portfolio beta of the four-stock portfolio and the required return on the portfolio.
8 A) Rates of return 9 Year Apple Returns Kroger Returns S&P 500 Market Index Returns 21 2020 61.9% 11.0% 27.8% -2 -3 2019 -7.7% 1.2% -8.0% 2018 35.2% -7.5% 20.9% 24 2017 15.5% -7.2% 11.4% 5 2016 -4.0% -4.7% -0.7% 26 27 28 BETA 1.895130563 0.153292786 Average Returns 48.4% -1.4% 10.3%
Step by Step Solution
3.40 Rating (162 Votes )
There are 3 Steps involved in it
The formulas and the inputs used is as follows The result is as follows A B D ... View full answer

Get step-by-step solutions from verified subject matter experts