

Question: Use the following graph to answer the next question. 6 AD2 AD, AS Price Level points P2 eBook Q Q Q2 Q3 References Real GDP
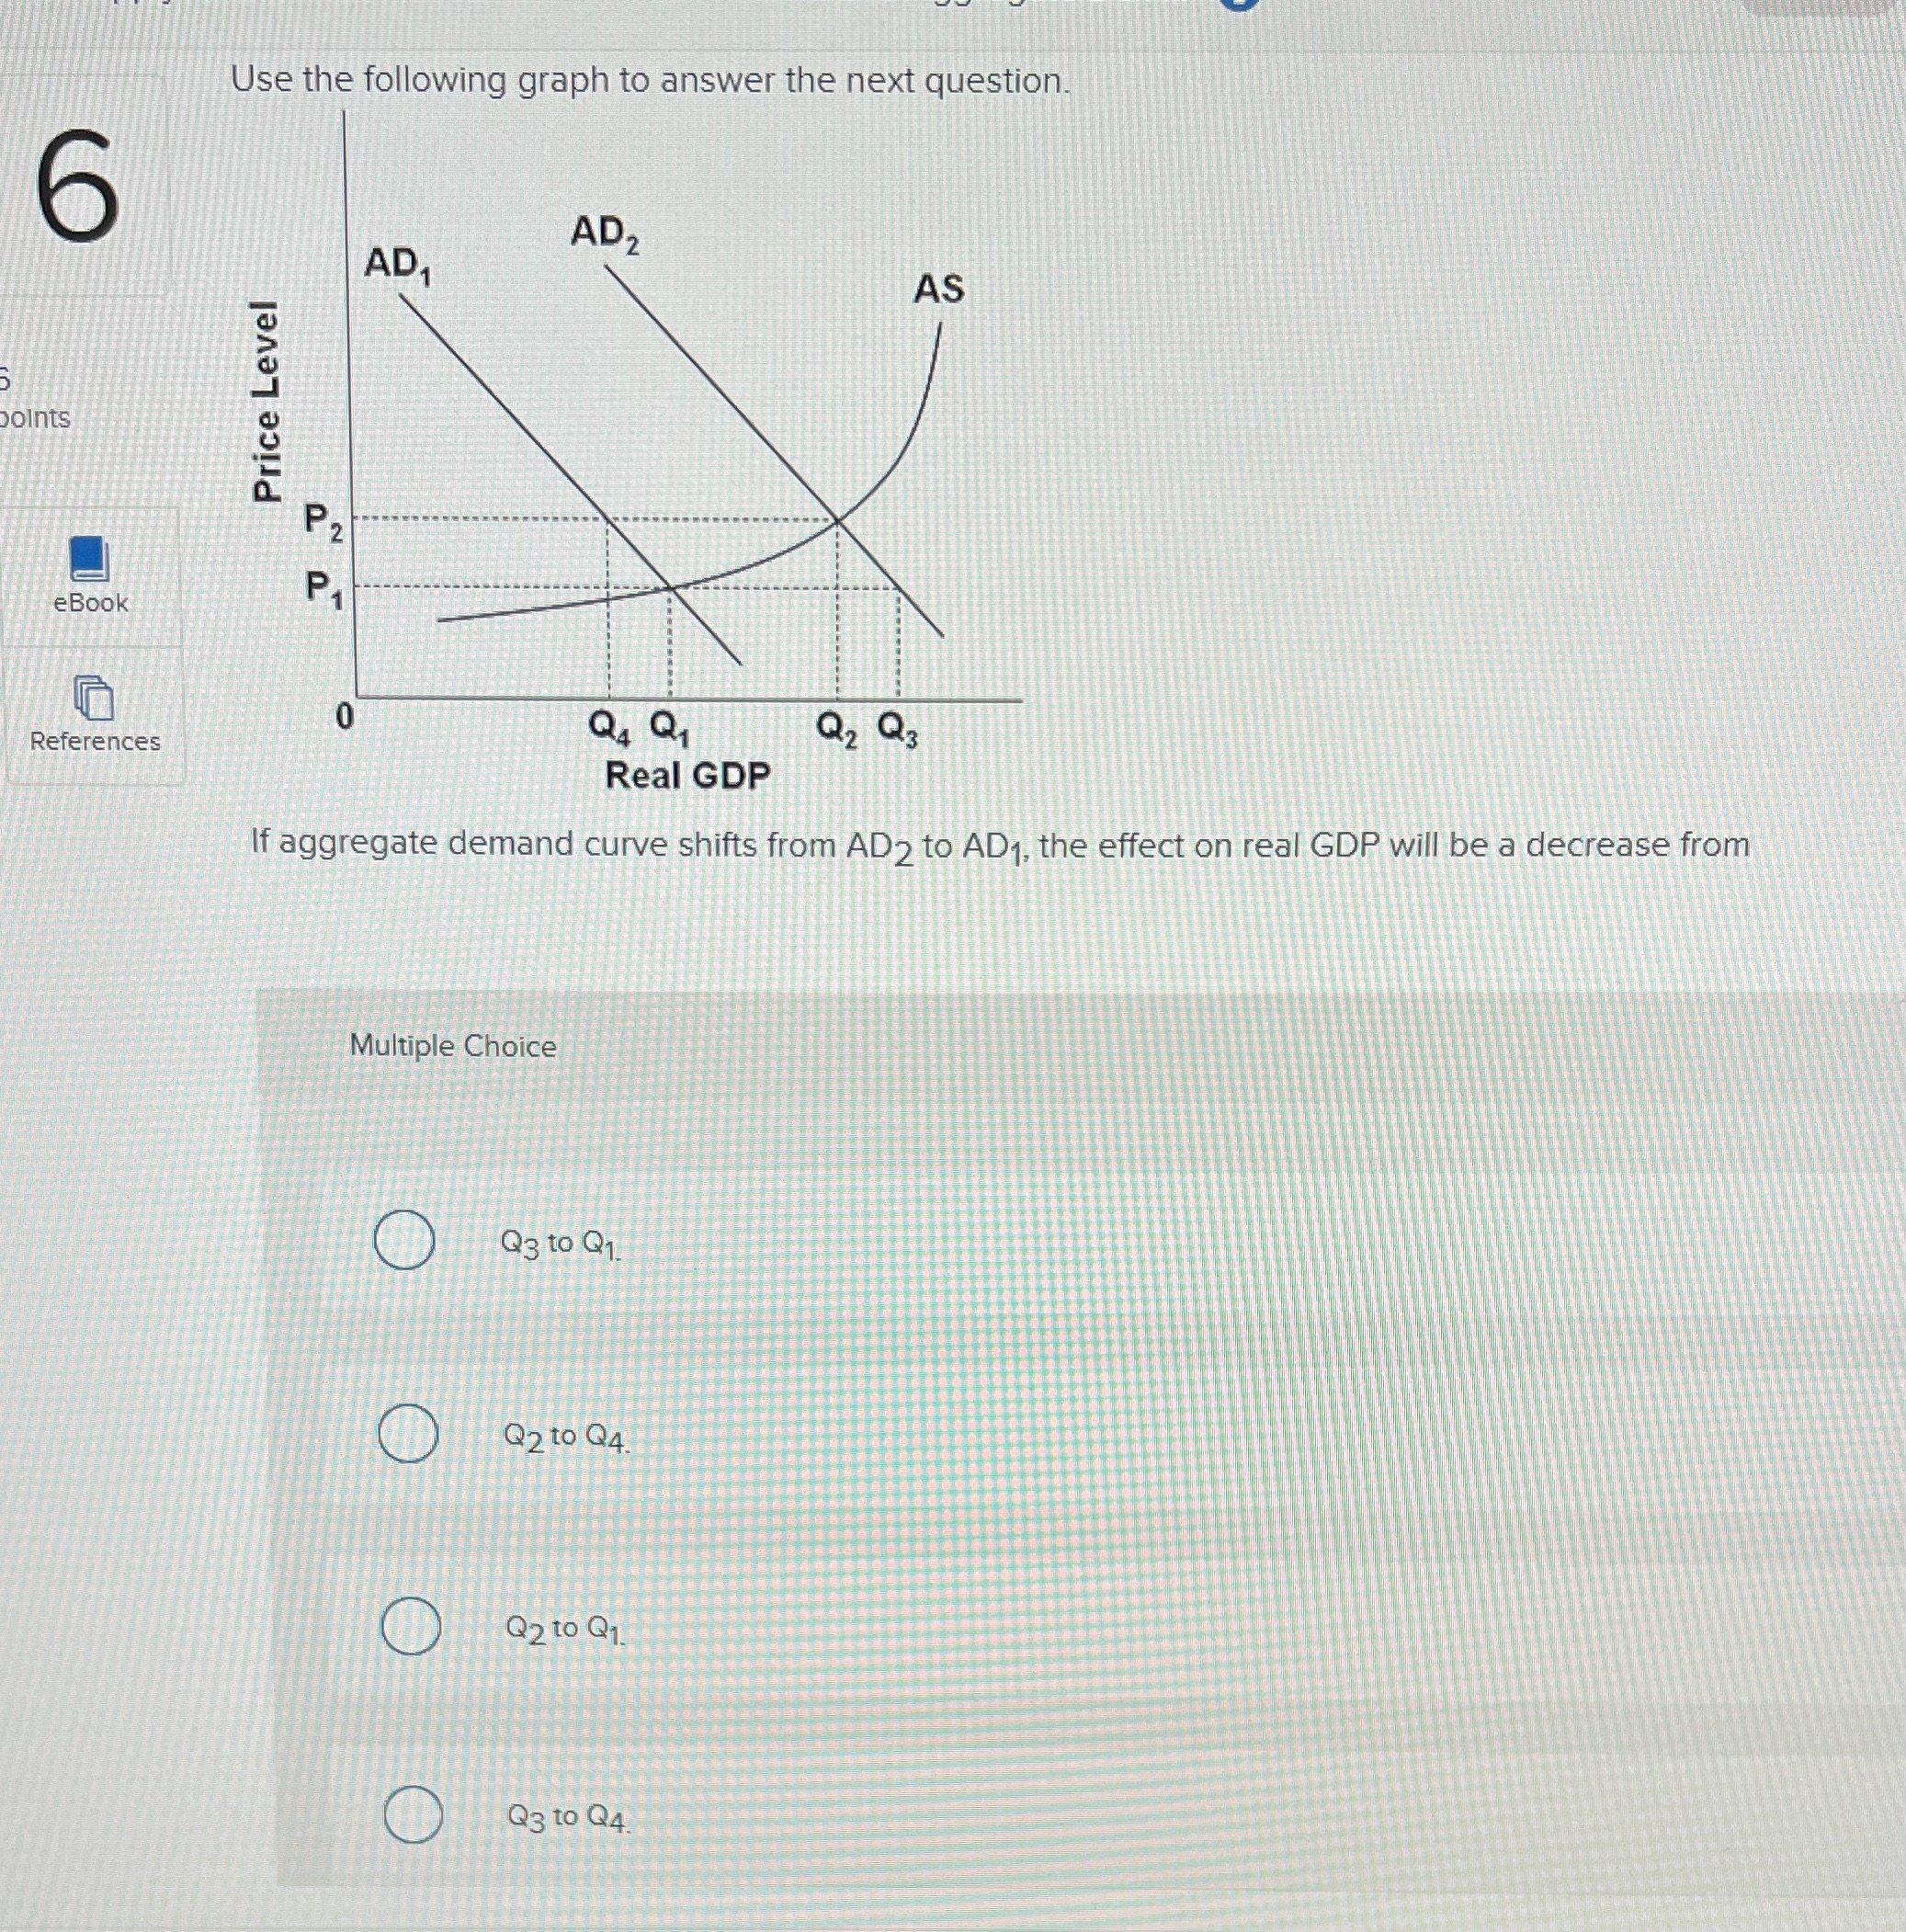

Use the following graph to answer the next question. 6 AD2 AD, AS Price Level points P2 eBook Q Q Q2 Q3 References Real GDP If aggregate demand curve shifts from AD2 to AD1, the effect on real GDP will be a decrease from Multiple Choice Q3 to Q1. Q2 to Q4. Q2 to Q1. Q3 to Q4
Step by Step Solution
There are 3 Steps involved in it
1 Expert Approved Answer
Step: 1 Unlock

Question Has Been Solved by an Expert!
Get step-by-step solutions from verified subject matter experts
Step: 2 Unlock
Step: 3 Unlock