

Question: Use the following graph to answer the question Figure 3.5 A decrease in demand is illustrated by a movement from @ point H to point

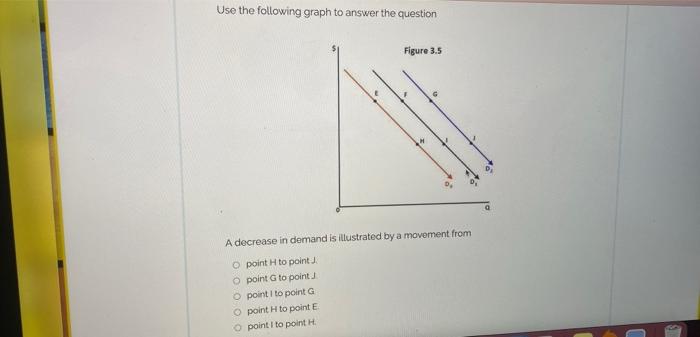
Use the following graph to answer the question Figure 3.5 A decrease in demand is illustrated by a movement from @ point H to point 1. point G to point ) point I to point G point H to point E point I to point H
Step by Step Solution
There are 3 Steps involved in it
1 Expert Approved Answer
Step: 1 Unlock

Question Has Been Solved by an Expert!
Get step-by-step solutions from verified subject matter experts
Step: 2 Unlock
Step: 3 Unlock