

Question: Use the following graph to answer the two questions below. Residuals O 40 50 60 70 80 Fitted values Question 1. Which of the following
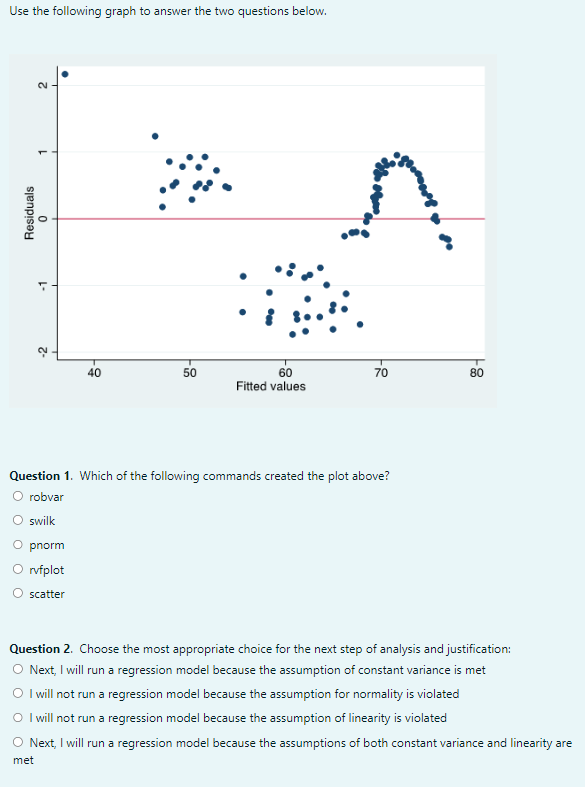
Use the following graph to answer the two questions below. Residuals O 40 50 60 70 80 Fitted values Question 1. Which of the following commands created the plot above? O robvar O swilk O pnorm O ifplot O scatter Question 2. Choose the most appropriate choice for the next step of analysis and justification: O Next, I will run a regression model because the assumption of constant variance is met O I will not run a regression model because the assumption for normality is violated O I will not run a regression model because the assumption of linearity is violated O Next, I will run a regression model because the assumptions of both constant variance and linearity are met
Step by Step Solution
There are 3 Steps involved in it

Get step-by-step solutions from verified subject matter experts