

Question: Use the following problem to answer each question. Problem: Agencies track airline flight delays to help consumers compare airlines. The following table outlines the number
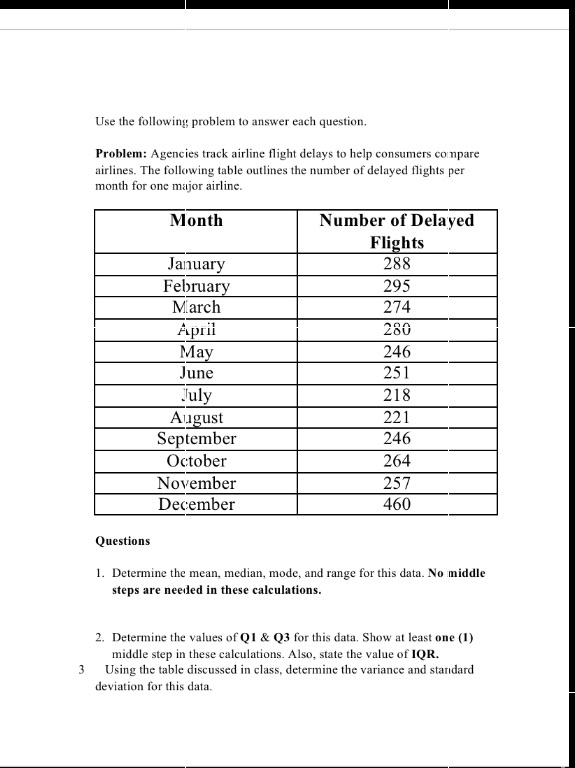
Use the following problem to answer each question. Problem: Agencies track airline flight delays to help consumers compare airlines. The following table outlines the number of delayed flights per month for one major airline. Month Number of Delayed Flights January 288 February 295 March 274 April 280 May 246 June 251 July 218 August 221 September 246 October 264 November 257 December 460 Questions 1. Determine the mean, median, mode, and range for this data. No middle steps are needed in these calculations. 2. Determine the values of Q1 & Q3 for this data. Show at least one (1) middle step in these calculations. Also, state the value of IQR. 3 Using the table discussed in class, determine the variance and standard deviation for this data
Step by Step Solution
There are 3 Steps involved in it

Get step-by-step solutions from verified subject matter experts