

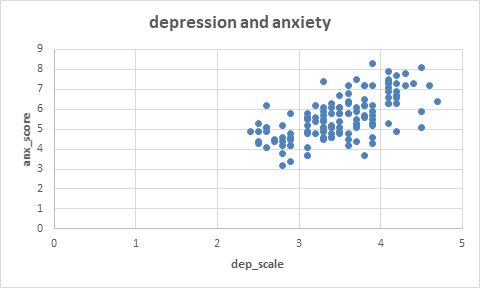
Question: Use the following scatterplot and Excel output to answer the questions. The two variables in this case are Depression Level (dep_scale) and Anxiety Score (anx_score)
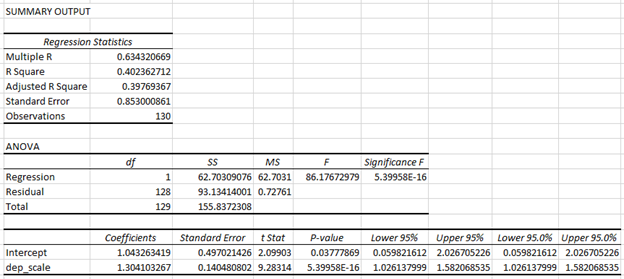

Use the following scatterplot and Excel output to answer the questions. The two variables in this case are Depression Level (dep_scale)and Anxiety Score (anx_score).


depression and anxiety anx score 4 5 dep_scaleSUMMARY OUTPUT Regression Statistics Multiple R 0.634320669 R Square 0.402362712 Adjusted R Square 0.39769367 Standard Error 0.853000861 Observations 130 ANOVA of 55 MS F Significance F Regression 1 62.70309076 62.7031 86.17672979 5.39958E-16 Residual 128 93.13414001 0.72761 Total 129 155.8372308 Coefficients Standard Error t Stot P-value Lower 95% Upper 95% Lower 95.0% Upper 95.0% Intercept 1.043263419 0.497021426 2.09903 0.03777869 0.059821612 2.026705226 0.059821612 2.026705226 dep_scale 1.304103267 0.140480802 9.28314 5.39958E-16 1.026137999 1.582068535 1.026137999 1.582068535
Step by Step Solution
There are 3 Steps involved in it

Get step-by-step solutions from verified subject matter experts