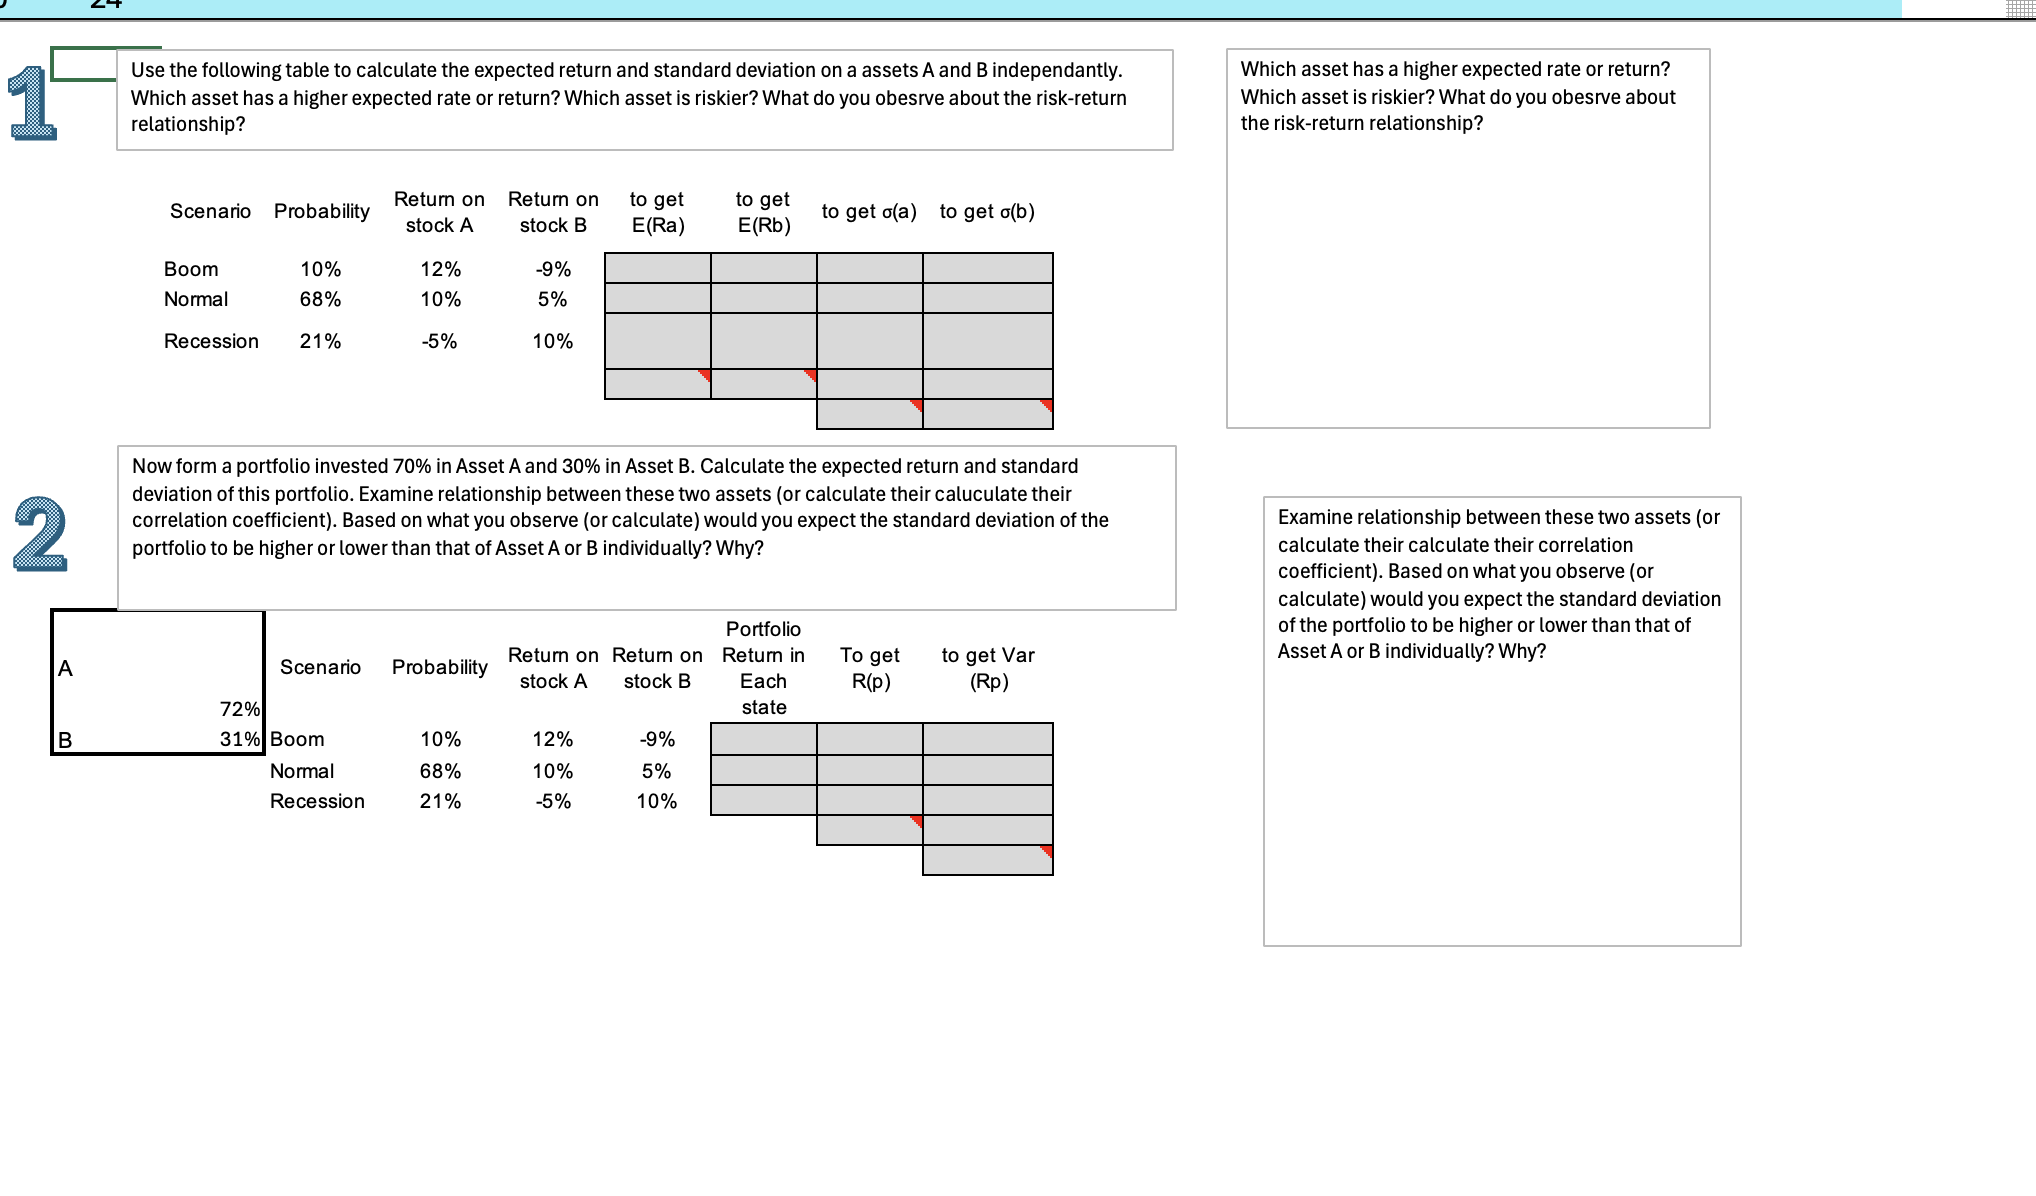
Question: - | Use the following table to calculate the expected return and standard deviation on a assets A and B independantly. Which asset has a

- | Use the following table to calculate the- | Use the following table to calculate the
- | Use the following table to calculate the expected return and standard deviation on a assets A and B independantly. Which asset has a higher expected rate or return? Which asset is riskier? What do you obesrve about the risk-return relationship? . o Retum on Retumon to get to get Scenario Probability stock A stock B E(Ra) E(Rb) to get o(a) to get a(b) Boom 10% 12% -9% Normal 68% 10% 5% Recession 21% -5% 10% Now form a portfolio invested 70% in Asset A and 30% in Asset B. Calculate the expected return and standard deviation of this portfolio. Examine relationship between these two assets (or calculate their caluculate their correlation coefficient). Based on what you observe (or calculate) would you expect the standard deviation of the portfolio to be higher or lower than that of Asset A or B individually? Why? Portfolio A Scenario Probability R::;;: Xn R::;!E gn ReE(:g]in TOR(?]?( to g(;:);/ar 72%| state B 31%|Boom 10% 12% -9% Normal 68% 10% 5% Recession 21% 5% 10%

Step by Step Solution

There are 3 Steps involved in it

1 Expert Approved Answer
Step: 1 Unlock blur-text-image
Question Has Been Solved by an Expert!

Get step-by-step solutions from verified subject matter experts

Step: 2 Unlock
Step: 3 Unlock

Students Have Also Explored These Related Finance Questions!