

Question: Use the format below to answe the below question (b) The government-wide financial statements for the City of Arborland for a three-year period are presented.
Use the format below to answe the below question (b)
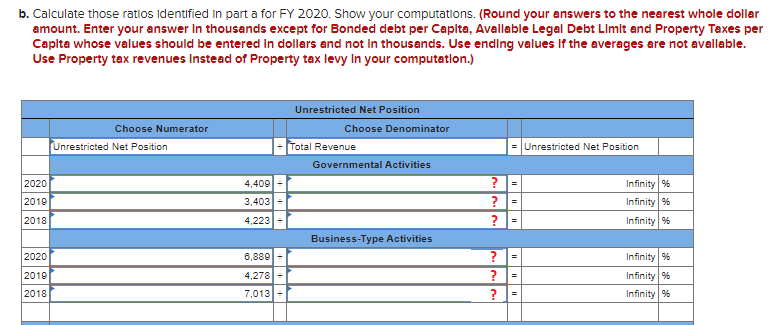
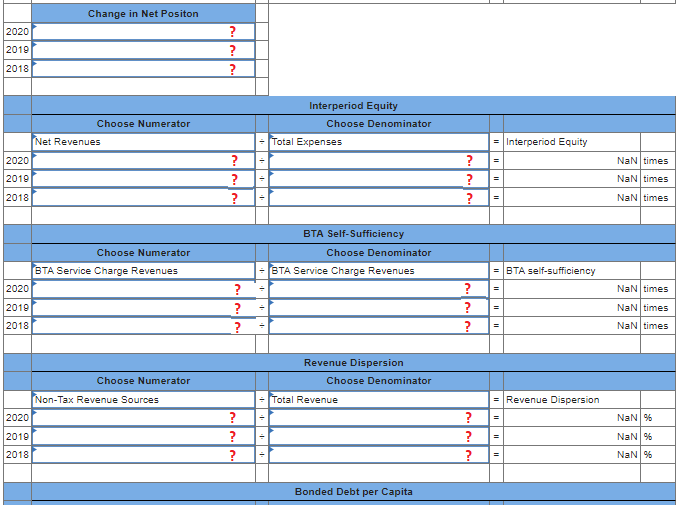
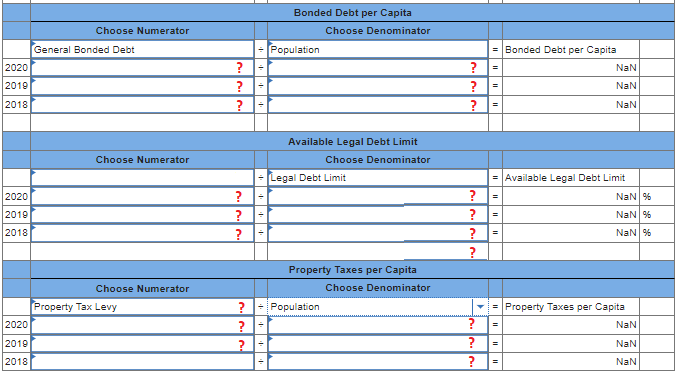
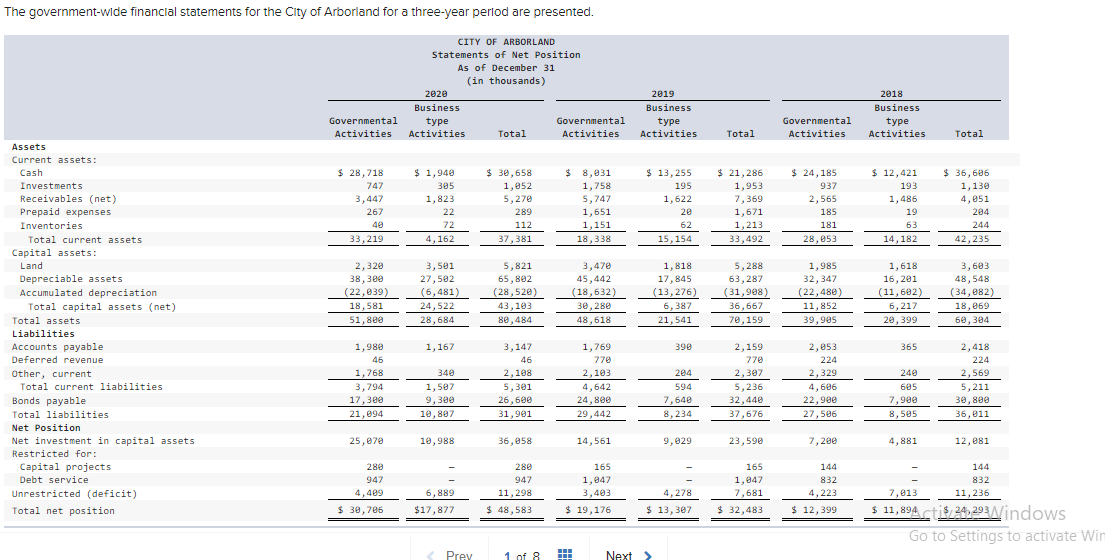
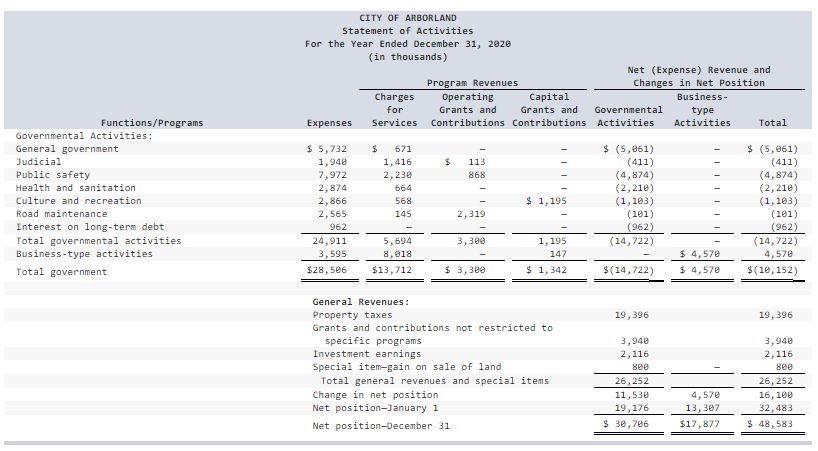
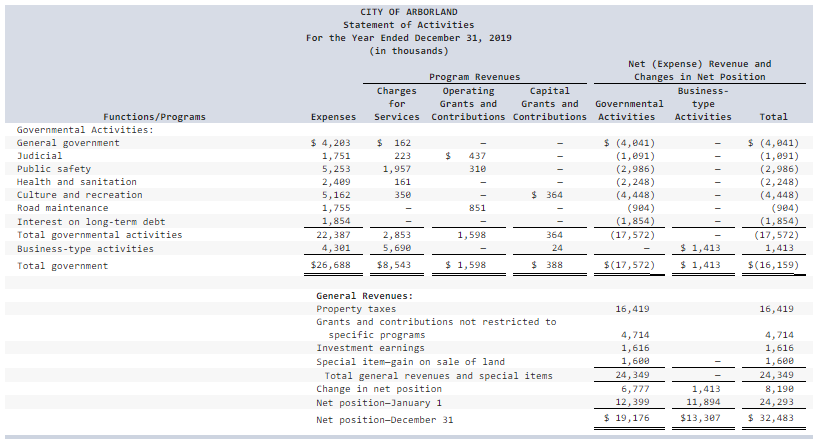
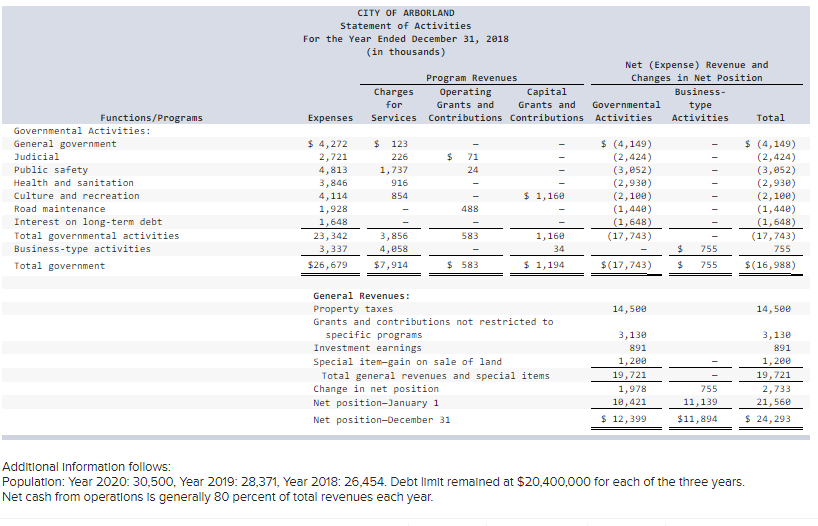
The government-wide financial statements for the City of Arborland for a three-year period are presented. CITY OF ARBORLAND Statements of Net Position As of December 31 (in thousands) 2020 Business type Governmental Activities Total Activities Governmental Activities 2019 Business type Activities 2018 Business type Activities Governmental Activities Total Total $ 28, 718 747 3,447 267 40 33,219 $ 1,940 305 1,823 22 72 4,162 $ 30,658 1,852 5,270 289 112 37,381 $ 8,931 1,758 5,747 1,651 1,151 18,338 $ 13,255 195 1,622 20 62 15,154 $ 21,286 1,953 7,369 1,671 1,213 33,492 $ 24, 185 937 2,565 185 181 28,053 $ 12,421 193 1,486 19 63 14,182 $36, 606 1,130 4,051 204 244 42,235 2,320 38, 380 (22,239) 18,581 51,880 3,501 27,502 (6,481) 24,522 28,684 5,821 65,802 (28,520) 43,103 80,484 3,47 45,442 (18,632) 30, 280 48,618 1,818 17,845 (13,276) 6,387 5,288 63,287 (31,908) 36,667 70,159 1,985 32,347 (22,480) 11,852 39,995 1,618 16, 201 (11,602) 6,217 20, 399 3,683 48,548 (34,082) 18,869 60,304 21,541 Assets Current assets: Cash Investments Receivables (net) Prepaid expenses Inventories Total current assets Capital assets: Land Depreciable assets Accumulated depreciation Total capital assets (net) Total assets Liabilities Accounts payable Deferred revenue Other, current Total current liabilities Bonds payable Total liabilities Net Position Net investment in capital assets Restricted for: Capital projects Debt service Unrestricted (deficit) Total net position 1,167 390 365 1,980 46 1,768 3,794 17,380 21,094 340 1,587 9,300 10,80 3,147 46 2,108 5, 301 26,600 31,991 1,769 77e 2,103 4,642 24,800 29,442 204 594 7,648 8,234 2,159 77e 2,307 5,236 32,440 37,676 2,053 224 2,329 4,606 22,980 27,506 240 685 7,990 8,595 2,418 224 2,569 5,211 30,800 36,011 25,70 10,988 36,58 14,561 9,029 23,599 7,280 4,881 12,081 144 832 280 947 4,499 $ 30,786 280 947 11,298 $ 48,583 165 1,847 3,403 165 1,047 7,681 $ 32,483 7,013 144 832 4,223 $ 12,399 4,278 $ 13, 307 11,236 6,889 $17,877 $ 19,176 $ 11,894 cti$ 24,293/indows Go to Settings to activate Wir Prev 1 of 8 Next > CITY OF ARBORLAND Statement of Activities For the Year Ended December 31, 2020 (in thousands) Charges for Services Program Revenues Operating Capital Grants and Grants and Contributions Contributions Net (Expense) Revenue and Changes in Net Position Business- Governmental type Activities Activities Total Expenses $ 113 868 Functions/Programs Governmental Activities: General government Judicial Public safety Health and sanitation Culture and recreation Road maintenance Interest on long-term debt Total governmental activities Business-type activities Total government $ 5,732 1,940 7,972 2,874 2,866 2,565 962 24,911 3,595 $28,506 671 1,416 2,230 664 568 145 $ (5,861) (411) (4,874) (2,210) (1,103) (101) (962) (14,722) $ 1,195 2,319 $ (5,261) (411) (4,874) (2,210) (1,183) (101) (962) (14,722) 4,570 $(10,152) 3,300 5,694 8,018 $13,712 1,195 147 $ 1,342 $ 4,579 $ 4,570 $ 3,380 $(14,722) 19,396 19, 396 General Revenues : Property taxes Grants and contributions not restricted to specific programs Investment earnings Special item-gain on sale of land Total general revenues and special items Change in net position Net position-January 1 Net position-December 31 3,940 2,116 800 26,252 11,530 19,176 3,948 2,116 Bee 26, 252 16, 100 32,483 4,578 13,307 $17,877 $ 30,706 $ 48,583 CITY OF ARBORLAND Statement of Activities For the Year Ended December 31, 2019 (in thousands ) Program Revenues Charges Operating Capital for Grants and Grants and Services Contributions Contributions Net (Expense) Revenue and Changes in Net Position Business- Governmental type Activities Activities Total Expenses $ Functions/Programs Governmental Activities: General government Judicial Public safety Health and sanitation Culture and recreation Road maintenance Interest on long-term debt Total governmental activities Business-type activities Total government $ 162 223 1,957 161 350 437 310 $364 $ 4,203 1,751 5,253 2,409 5,162 1,755 1,854 22,387 4,301 $26,688 $ (4,641) (1,691) (2,986) (2,248) (4,448) (984) (1,854) (17,572) 851 $ (4,041) (1,091) (2,986) (2,248) (4,448) (984) (1,854) (17,572) 1,413 $(16,159) 1,598 2,853 5,690 $8,543 364 24 $ 1,413 $ 1,413 $ 1,598 $ 388 $(17,572) 16,419 16,419 General Revenues: Property taxes Grants and contributions not restricted to specific programs Investment earnings Special item-gain on sale of land Total general revenues and special items Change in net position Net position-January 1 Net position-December 31 4,714 1,616 1,600 24,349 6,777 12,399 $ 19,176 4,714 1,616 1,6ee 24, 349 8,190 24, 293 $ 32,483 1,413 11,894 $13,387 CITY OF ARBORLAND Statement of Activities For the Year Ended December 31, 2018 (in thousands) Net (Expense) Revenue and Program Revenues Changes in Net Position Charges Operating Capital Business- for Grants and Grants and Governmental type Expenses Services Contributions Contributions Activities Activities Total $ Functions/Programs Governmental Activities: General government Judicial Public safety Health and sanitation Culture and recreation Road maintenance Interest on long-term debt Total governmental activities Business-type activities Total government $ 123 226 1,737 916 854 71 24 $ 4,272 2,721 4,813 3,846 4,114 1,928 1,648 23,342 3,337 $26,679 $ (4,149) (2,424) (3,652) (2,930) (2,180) (1,440) (1,648) (17,743) $ 1,160 488 $ (4,149) (2,424) (3,052) (2,930) (2,100) (1,440) (1,648) (17,743) 755 $(16,988) 583 3,856 4,058 $7,914 1,160 34 $ 1,194 $ 755 755 $ 583 $(17,743) $ 14,500 14,500 General Revenues: Property taxes Grants and contributions not restricted to specific programs Investment earnings Special item-gain on sale of land Total general revenues and special items Change in net position Net position-January 1 Net position-December 31 3,130 891 1,200 19,721 1,978 19,421 $ 12,399 3, 130 891 1,200 19,721 2,733 21,560 $ 24, 293 755 11,139 $11,894 Additional Information follows: Population: Year 2020:30,500, Year 2019:28,371, Year 2018: 26,454. Debt limit remained at $20,400,000 for each of the three years. Net cash from operations is generally 80 percent of total revenues each year. b. Calculate those ratios Identified in part a for FY 2020. Show your computations. (Round your answers to the nearest whole dollar amount. Enter your answer in thousands except for Bonded debt per Capita, Available Legal Debt Limit and Property Taxes per Capita whose values should be entered in dollars and not in thousands. Use ending values If the averages are not available. Use Property tax revenues Instead of Property tax levy In your computatlon.) Choose Numerator Unrestricted Net Position Unrestricted Net Position Choose Denominator Total Revenue Governmental Activities = Unrestricted Net Position 2020 4,400 3,403 2019 ? = ? ? = = Infinity% Infinity 96 Infinity % 2018 4,223- Business-Type Activities 2020 8,889 - Infinity% 2010 4,278 - 7.013- = ? ? ? Infinity % Infinity % 2018 Change in Net Positon 2020 2019 ? ? ? 2018 Choose Numerator Net Revenues 2020 Interperiod Equity Choose Denominator - Total Expenses = Interperiod Equity NaN times NaN times 2019 2018 ? ? ? ? ? NaN times Choose Numerator BTA Self-Sufficiency Choose Denominator BTA Service Charge Revenues = BTA self-sufficiency NaN times GTA Service Charge Revenues 2020 2019 2018 ? ? ? ? ? ? = | NaN times NaN times Revenue Dispersion Choose Denominator Choose Numerator Total Revenue = Revenue Dispersion Non-Tax Revenue Sources 2020 NaN% 2010 ? ? ? ? ? ? = NaN% NaN% 2018 II Bonded Debt per Capita Bonded Debt per Capita Choose Denominator - Population Choose Numerator General Bonded Debt 2020 2019 = Bonded Debt per Capita NaN - ? ? ? ? ? ? NaN NaN 2018 Choose Numerator Available Legal Debt Limit Choose Denominator Legal Debt Limit 2020 = ? ? ? 2019 = Available Legal Debt Limit NaN% NaN% NaN% ? ? ? ? 2018 = Property Taxes per Capita Choose Denominator Choose Numerator Property Tax Levy 2020 ? Population = Property Taxes per Capita NaN ? 2019 ? n... = NaN 2018 ? = NaN The government-wide financial statements for the City of Arborland for a three-year period are presented. CITY OF ARBORLAND Statements of Net Position As of December 31 (in thousands) 2020 Business type Governmental Activities Total Activities Governmental Activities 2019 Business type Activities 2018 Business type Activities Governmental Activities Total Total $ 28, 718 747 3,447 267 40 33,219 $ 1,940 305 1,823 22 72 4,162 $ 30,658 1,852 5,270 289 112 37,381 $ 8,931 1,758 5,747 1,651 1,151 18,338 $ 13,255 195 1,622 20 62 15,154 $ 21,286 1,953 7,369 1,671 1,213 33,492 $ 24, 185 937 2,565 185 181 28,053 $ 12,421 193 1,486 19 63 14,182 $36, 606 1,130 4,051 204 244 42,235 2,320 38, 380 (22,239) 18,581 51,880 3,501 27,502 (6,481) 24,522 28,684 5,821 65,802 (28,520) 43,103 80,484 3,47 45,442 (18,632) 30, 280 48,618 1,818 17,845 (13,276) 6,387 5,288 63,287 (31,908) 36,667 70,159 1,985 32,347 (22,480) 11,852 39,995 1,618 16, 201 (11,602) 6,217 20, 399 3,683 48,548 (34,082) 18,869 60,304 21,541 Assets Current assets: Cash Investments Receivables (net) Prepaid expenses Inventories Total current assets Capital assets: Land Depreciable assets Accumulated depreciation Total capital assets (net) Total assets Liabilities Accounts payable Deferred revenue Other, current Total current liabilities Bonds payable Total liabilities Net Position Net investment in capital assets Restricted for: Capital projects Debt service Unrestricted (deficit) Total net position 1,167 390 365 1,980 46 1,768 3,794 17,380 21,094 340 1,587 9,300 10,80 3,147 46 2,108 5, 301 26,600 31,991 1,769 77e 2,103 4,642 24,800 29,442 204 594 7,648 8,234 2,159 77e 2,307 5,236 32,440 37,676 2,053 224 2,329 4,606 22,980 27,506 240 685 7,990 8,595 2,418 224 2,569 5,211 30,800 36,011 25,70 10,988 36,58 14,561 9,029 23,599 7,280 4,881 12,081 144 832 280 947 4,499 $ 30,786 280 947 11,298 $ 48,583 165 1,847 3,403 165 1,047 7,681 $ 32,483 7,013 144 832 4,223 $ 12,399 4,278 $ 13, 307 11,236 6,889 $17,877 $ 19,176 $ 11,894 cti$ 24,293/indows Go to Settings to activate Wir Prev 1 of 8 Next > CITY OF ARBORLAND Statement of Activities For the Year Ended December 31, 2020 (in thousands) Charges for Services Program Revenues Operating Capital Grants and Grants and Contributions Contributions Net (Expense) Revenue and Changes in Net Position Business- Governmental type Activities Activities Total Expenses $ 113 868 Functions/Programs Governmental Activities: General government Judicial Public safety Health and sanitation Culture and recreation Road maintenance Interest on long-term debt Total governmental activities Business-type activities Total government $ 5,732 1,940 7,972 2,874 2,866 2,565 962 24,911 3,595 $28,506 671 1,416 2,230 664 568 145 $ (5,861) (411) (4,874) (2,210) (1,103) (101) (962) (14,722) $ 1,195 2,319 $ (5,261) (411) (4,874) (2,210) (1,183) (101) (962) (14,722) 4,570 $(10,152) 3,300 5,694 8,018 $13,712 1,195 147 $ 1,342 $ 4,579 $ 4,570 $ 3,380 $(14,722) 19,396 19, 396 General Revenues : Property taxes Grants and contributions not restricted to specific programs Investment earnings Special item-gain on sale of land Total general revenues and special items Change in net position Net position-January 1 Net position-December 31 3,940 2,116 800 26,252 11,530 19,176 3,948 2,116 Bee 26, 252 16, 100 32,483 4,578 13,307 $17,877 $ 30,706 $ 48,583 CITY OF ARBORLAND Statement of Activities For the Year Ended December 31, 2019 (in thousands ) Program Revenues Charges Operating Capital for Grants and Grants and Services Contributions Contributions Net (Expense) Revenue and Changes in Net Position Business- Governmental type Activities Activities Total Expenses $ Functions/Programs Governmental Activities: General government Judicial Public safety Health and sanitation Culture and recreation Road maintenance Interest on long-term debt Total governmental activities Business-type activities Total government $ 162 223 1,957 161 350 437 310 $364 $ 4,203 1,751 5,253 2,409 5,162 1,755 1,854 22,387 4,301 $26,688 $ (4,641) (1,691) (2,986) (2,248) (4,448) (984) (1,854) (17,572) 851 $ (4,041) (1,091) (2,986) (2,248) (4,448) (984) (1,854) (17,572) 1,413 $(16,159) 1,598 2,853 5,690 $8,543 364 24 $ 1,413 $ 1,413 $ 1,598 $ 388 $(17,572) 16,419 16,419 General Revenues: Property taxes Grants and contributions not restricted to specific programs Investment earnings Special item-gain on sale of land Total general revenues and special items Change in net position Net position-January 1 Net position-December 31 4,714 1,616 1,600 24,349 6,777 12,399 $ 19,176 4,714 1,616 1,6ee 24, 349 8,190 24, 293 $ 32,483 1,413 11,894 $13,387 CITY OF ARBORLAND Statement of Activities For the Year Ended December 31, 2018 (in thousands) Net (Expense) Revenue and Program Revenues Changes in Net Position Charges Operating Capital Business- for Grants and Grants and Governmental type Expenses Services Contributions Contributions Activities Activities Total $ Functions/Programs Governmental Activities: General government Judicial Public safety Health and sanitation Culture and recreation Road maintenance Interest on long-term debt Total governmental activities Business-type activities Total government $ 123 226 1,737 916 854 71 24 $ 4,272 2,721 4,813 3,846 4,114 1,928 1,648 23,342 3,337 $26,679 $ (4,149) (2,424) (3,652) (2,930) (2,180) (1,440) (1,648) (17,743) $ 1,160 488 $ (4,149) (2,424) (3,052) (2,930) (2,100) (1,440) (1,648) (17,743) 755 $(16,988) 583 3,856 4,058 $7,914 1,160 34 $ 1,194 $ 755 755 $ 583 $(17,743) $ 14,500 14,500 General Revenues: Property taxes Grants and contributions not restricted to specific programs Investment earnings Special item-gain on sale of land Total general revenues and special items Change in net position Net position-January 1 Net position-December 31 3,130 891 1,200 19,721 1,978 19,421 $ 12,399 3, 130 891 1,200 19,721 2,733 21,560 $ 24, 293 755 11,139 $11,894 Additional Information follows: Population: Year 2020:30,500, Year 2019:28,371, Year 2018: 26,454. Debt limit remained at $20,400,000 for each of the three years. Net cash from operations is generally 80 percent of total revenues each year. b. Calculate those ratios Identified in part a for FY 2020. Show your computations. (Round your answers to the nearest whole dollar amount. Enter your answer in thousands except for Bonded debt per Capita, Available Legal Debt Limit and Property Taxes per Capita whose values should be entered in dollars and not in thousands. Use ending values If the averages are not available. Use Property tax revenues Instead of Property tax levy In your computatlon.) Choose Numerator Unrestricted Net Position Unrestricted Net Position Choose Denominator Total Revenue Governmental Activities = Unrestricted Net Position 2020 4,400 3,403 2019 ? = ? ? = = Infinity% Infinity 96 Infinity % 2018 4,223- Business-Type Activities 2020 8,889 - Infinity% 2010 4,278 - 7.013- = ? ? ? Infinity % Infinity % 2018 Change in Net Positon 2020 2019 ? ? ? 2018 Choose Numerator Net Revenues 2020 Interperiod Equity Choose Denominator - Total Expenses = Interperiod Equity NaN times NaN times 2019 2018 ? ? ? ? ? NaN times Choose Numerator BTA Self-Sufficiency Choose Denominator BTA Service Charge Revenues = BTA self-sufficiency NaN times GTA Service Charge Revenues 2020 2019 2018 ? ? ? ? ? ? = | NaN times NaN times Revenue Dispersion Choose Denominator Choose Numerator Total Revenue = Revenue Dispersion Non-Tax Revenue Sources 2020 NaN% 2010 ? ? ? ? ? ? = NaN% NaN% 2018 II Bonded Debt per Capita Bonded Debt per Capita Choose Denominator - Population Choose Numerator General Bonded Debt 2020 2019 = Bonded Debt per Capita NaN - ? ? ? ? ? ? NaN NaN 2018 Choose Numerator Available Legal Debt Limit Choose Denominator Legal Debt Limit 2020 = ? ? ? 2019 = Available Legal Debt Limit NaN% NaN% NaN% ? ? ? ? 2018 = Property Taxes per Capita Choose Denominator Choose Numerator Property Tax Levy 2020 ? Population = Property Taxes per Capita NaN ? 2019 ? n... = NaN 2018 ? = NaN
Step by Step Solution
There are 3 Steps involved in it

Get step-by-step solutions from verified subject matter experts