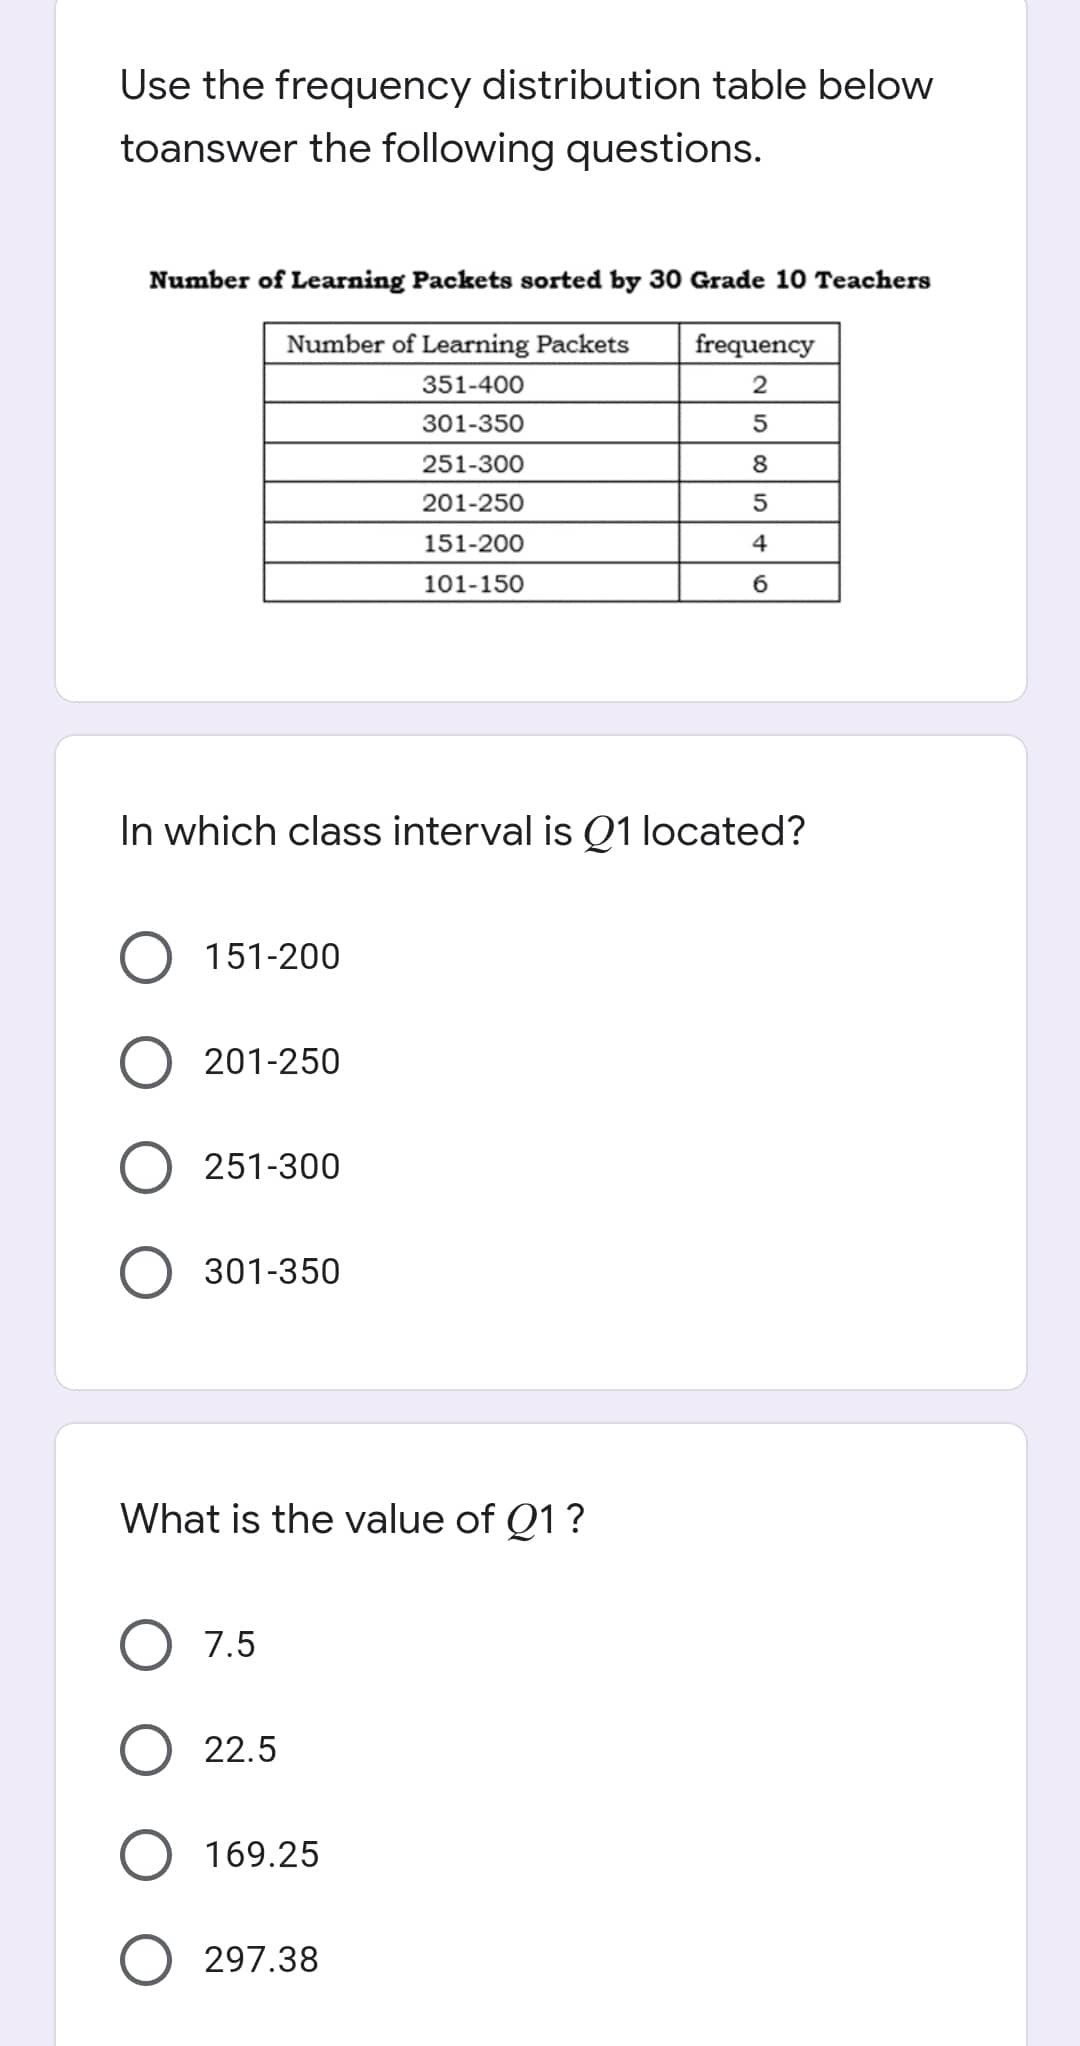
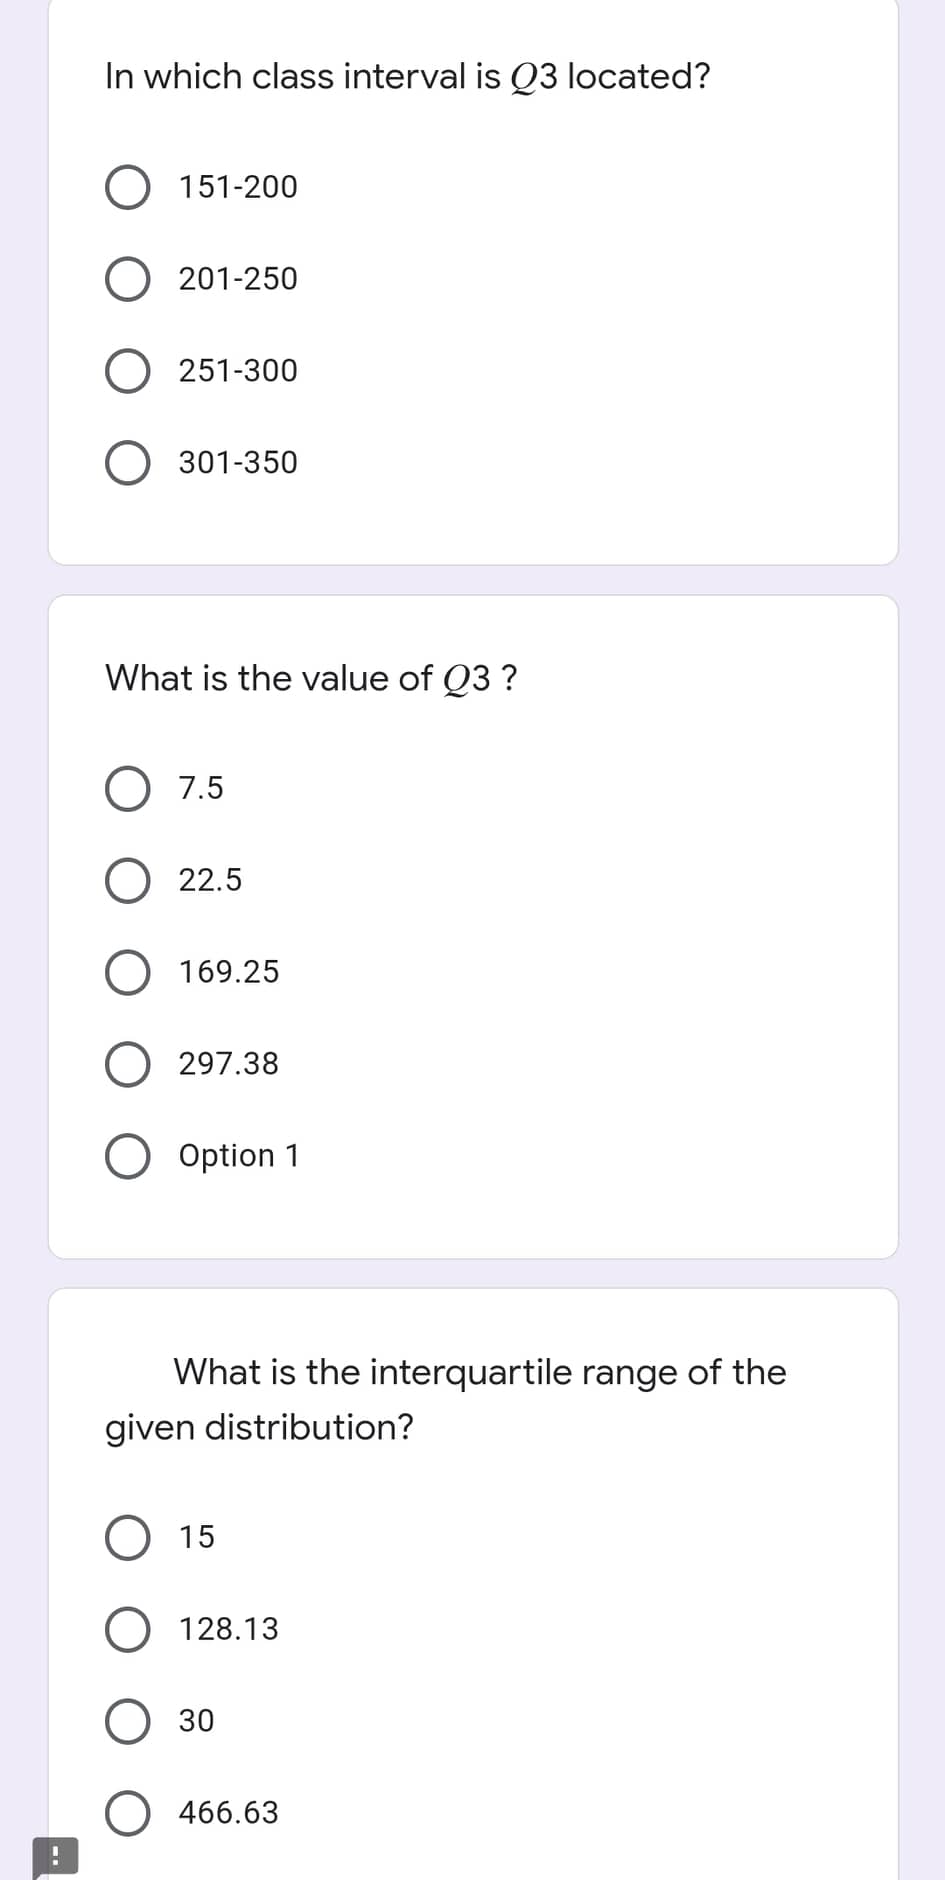
Question: Use the frequency distribution table below toanswer the following questions. Number of Learning Packets sorted by 30 Grade 10 Teachers Number of Learning Packets frequency

Use the frequency distribution table belowUse the frequency distribution table below
Use the frequency distribution table below toanswer the following questions. Number of Learning Packets sorted by 30 Grade 10 Teachers Number of Learning Packets frequency 351-400 IN 301-350 5 251-300 201-250 151-200 A 101-150 In which class interval is Q1 located? O 151-200 O 201-250 O 251-300 O 301-350 What is the value of Q1 ? O 7.5 22.5 O 169.25 O 297.38In which class interval is Q3 located? What is the interquartile range of the given distribution

Step by Step Solution

There are 3 Steps involved in it

1 Expert Approved Answer
Step: 1 Unlock blur-text-image
Question Has Been Solved by an Expert!

Get step-by-step solutions from verified subject matter experts

Step: 2 Unlock
Step: 3 Unlock

Students Have Also Explored These Related Mathematics Questions!