

Question: Use the given data set to complete parts (a) through (c) below. (Use a = 0.05.) 10 8 13 9 11 14 6 4 12
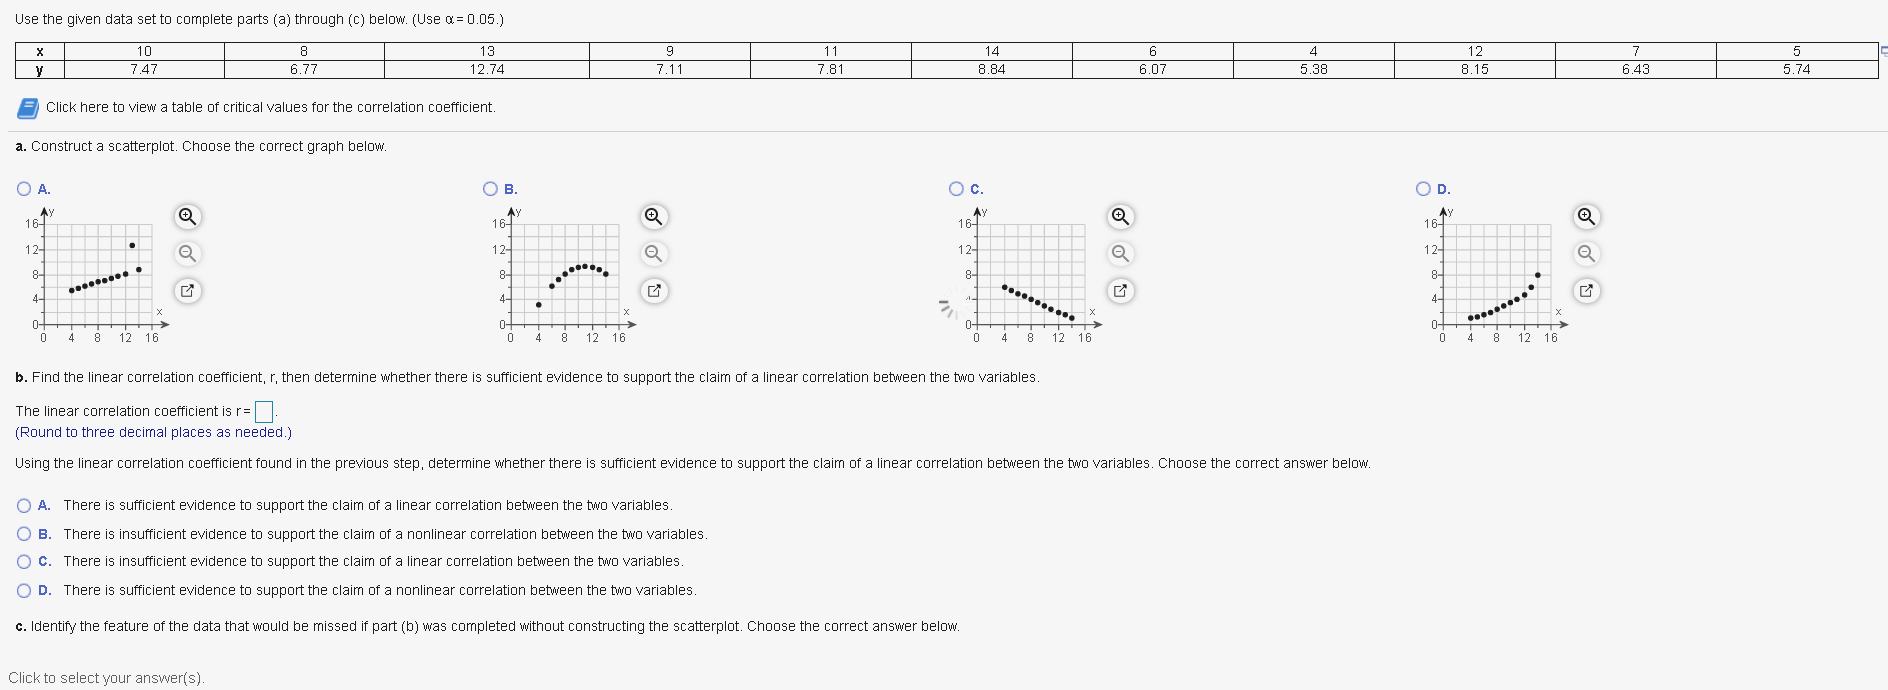
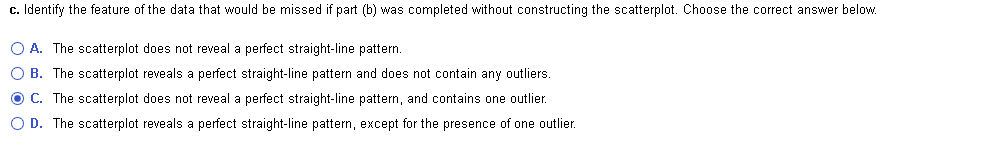
Use the given data set to complete parts (a) through (c) below. (Use a = 0.05.) 10 8 13 9 11 14 6 4 12 7 5 7.47 6.77 12.74 7.11 781 8.84 6.07 5.38 8.15 6.43 5.74 Click here to view a table of critical values for the correlation coefficient. a. Construct a scatterplot. Choose the correct graph below. O A. O B. O c. OD. 16- 16- 16- 12- 12- 12- 12- 8- ........9 8- 8- 8- 4- ........... X ........ . Of 12 16 12 16 8 12 16 12 16 b. Find the linear correlation coefficient, r, then determine whether there is sufficient evidence to support the claim of a linear correlation between the two variables. The linear correlation coefficient is r= . (Round to three decimal places as needed.) Using the linear correlation coefficient found in the previous step, determine whether there is sufficient evidence to support the claim of a linear correlation between the two variables. Choose the correct answer below. O A. There is sufficient evidence to support the claim of a linear correlation between the two variables. O B. There is insufficient evidence to support the claim of a nonlinear correlation between the two variables. O C. There is insufficient evidence to support the claim of a linear correlation between the two variables O D. There is sufficient evidence to support the claim of a nonlinear correlation between the two variables. c. Identify the feature of the data that would be missed if part (b) was completed without constructing the scatterplot. Choose the correct answer below. Click to select your answer(s).c. Identify the feature of the data that would be missed if part (b) was completed without constructing the scatterplot. Choose the correct answer below. O A. The scatterplot does not reveal a perfect straight-line pattern. O B. The scatterplot reveals a perfect straight-line pattern and does not contain any outliers. O C. The scatterplot does not reveal a perfect straight-line pattern, and contains one outlier. O D. The scatterplot reveals a perfect straight-line pattern, except for the presence of one outlier
Step by Step Solution
There are 3 Steps involved in it

Get step-by-step solutions from verified subject matter experts