

Question: Use the given probability density function over the indicated interval to find the mean, variance, and standard deviation of the random variable. Then sketch the
Use the given probability density function over the indicated interval to find the mean, variance, and standard deviation of the random variable. Then sketch the graph of the density function and locate the mean on the graph.
f(t) =t/72 ,[0,12]
(a) mean of the random variable
(b) variance of the random variable
(c) standard deviation of the random variable
(d) Sketch the graph of the density function and locate the mean on the graph.
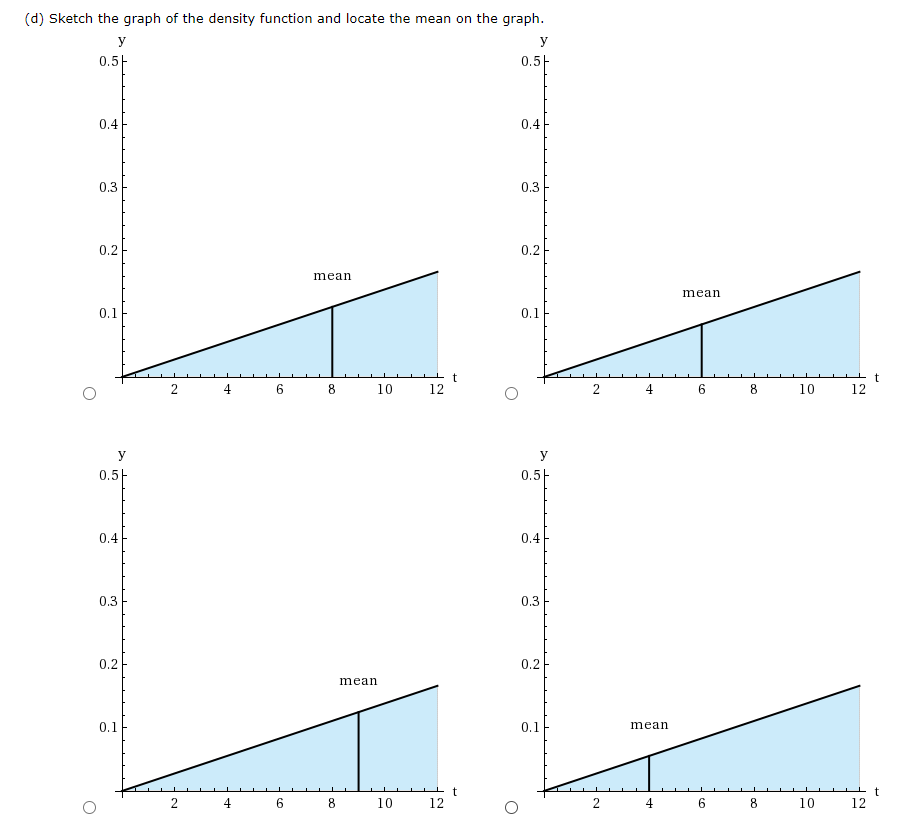
(d) Sketch the graph of the density function and locate the mean on the graph. 0.51 y 0.5/ 0.4 0.4 0.3 - 0.3 - 0.2 0.2 mean 0.1 0.1 / mean O 2 4 6 8 10 12 O 2 4 6 8 10 12 0.5/ y 0.5 0.4 0.4 0.3 0.3- 0.2 mean 0.1H 0.1 mean O 2 4 6 8 10 t 12 O 2 4 6 8 10 12
Step by Step Solution
There are 3 Steps involved in it

Get step-by-step solutions from verified subject matter experts