

Question: Use the graph attached below as a starting point. Add curves, labels, etc. to this graph in order to show the following: 1. Show that
Use the graph attached below as a starting point. Add curves, labels, etc. to this graph in order to show the following:
1. Show that this good has a $4/unit negative externality (external cost), such as pollution.
2.Shade the area that represents the Deadweight Loss (lost gains from trade) caused by the external cost.
3. Show a tax or subsidy wedge (whichever you think is appropriate) that will solve the problem of the external cost.
4. Show the socially optimal level of production that the Pigouvian tax or subsidy above will help the market to achieve.
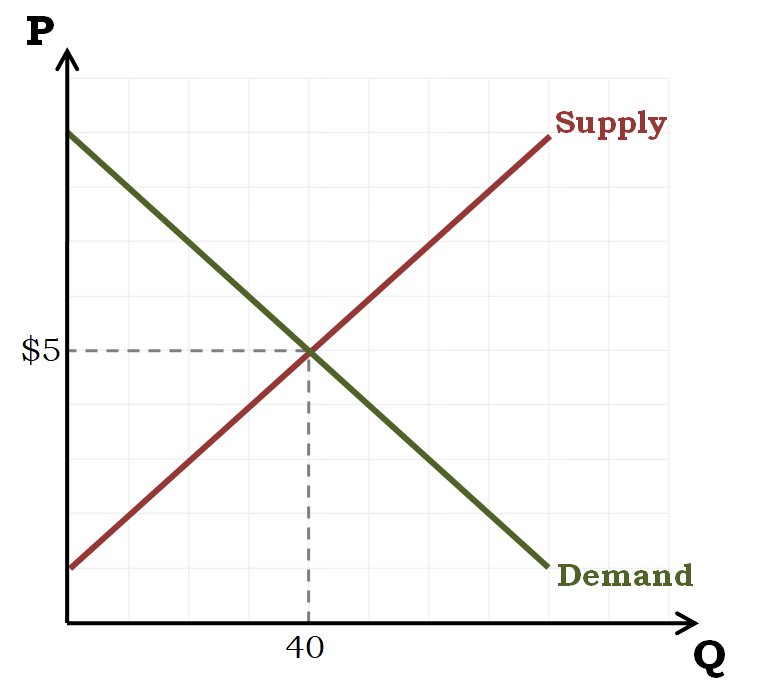
P Supply $5 Demand V 40 O
Step by Step Solution
There are 3 Steps involved in it
1 Expert Approved Answer
Step: 1 Unlock

Question Has Been Solved by an Expert!
Get step-by-step solutions from verified subject matter experts
Step: 2 Unlock
Step: 3 Unlock