

Question: Use the graph below to answer question 1: Interest rate. F 1. Based on the graph above, starting from equilibrium at interest rate ri and
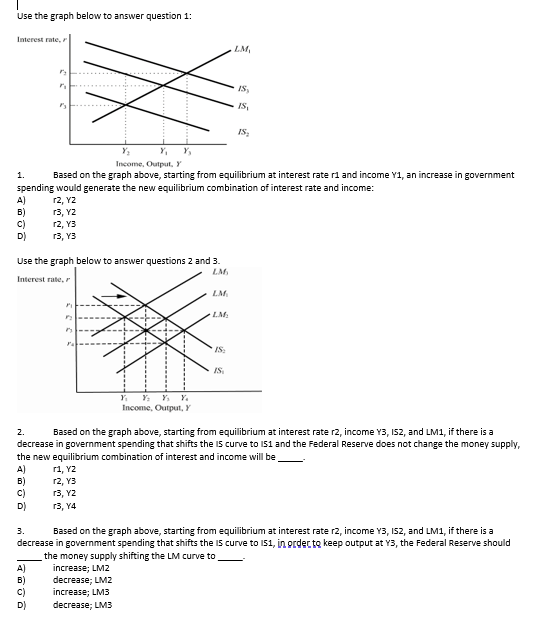
Use the graph below to answer question 1: Interest rate. F 1. Based on the graph above, starting from equilibrium at interest rate ri and income 1, an increase in government spending would generate the new equilibrium combination of interest rate and income: 12, Y2 B) 13, Y2 r2, Y3 13, Y3 Use the graph below to answer questions 2 and 3. Interest rate. r 2. Based on the graph above, starting from equilibrium at interest rate r2, income Y3, IS2, and LM1, if there is a decrease in government spending that shifts the IS curve to 151 and the Federal Reserve does not change the money supply, the new equilibrium combination of interest and income will be r1, Y2 B) 12, Y3 C) 13, YZ 13, Y4 3 Based on the graph above, starting from equilibrium at interest rate r2, income Y3, 152, and LM1, if there is a decrease in government spending that shifts the is curve to 151, in order to keep output at 13, the Federal Reserve should the money supply shifting the LM curve to increase; LM2 decrease; UMZ increase; LMS decrease; LIME
Step by Step Solution
There are 3 Steps involved in it

Get step-by-step solutions from verified subject matter experts