

Question: Use the graph below to answer the following questions. a) What is the approximate value of y when x is 3? b) What is the
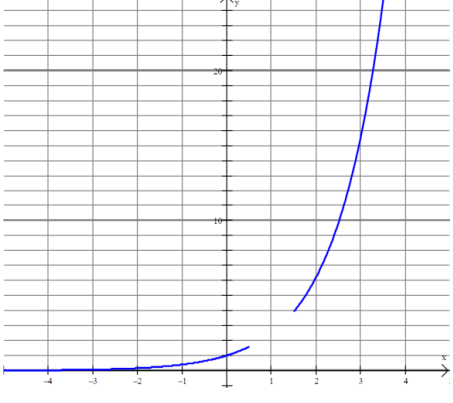
Use the graph below to answer the following questions.
a) What is the approximate value of y when x is 3?
b) What is the x value, to 1 decimal place, when y is 7?
c) What is the y-intercept of the relation?
d) Which of these equations is this graph more likely to represent? Explain. y = 0.5^x , y = 2.5^x or y = 4.5^x
e) A small portion of the graph around x = 1 is missing. This was done to make question d) more challenging. How could omitting this part of the graph possibly make question e more challenging?
f) Use your choice of equation from question d) above to calculate the value of y when x is 1. Comment as to whether your answer makes sense when compared with the missing portion of the graph. 4T 4C 2.
Step by Step Solution
There are 3 Steps involved in it

Get step-by-step solutions from verified subject matter experts