

Question: Use the graph below to answer the following questions. Demand curve Price Quantity 12 10 0 8 2 10 6 4 4 6 8 8
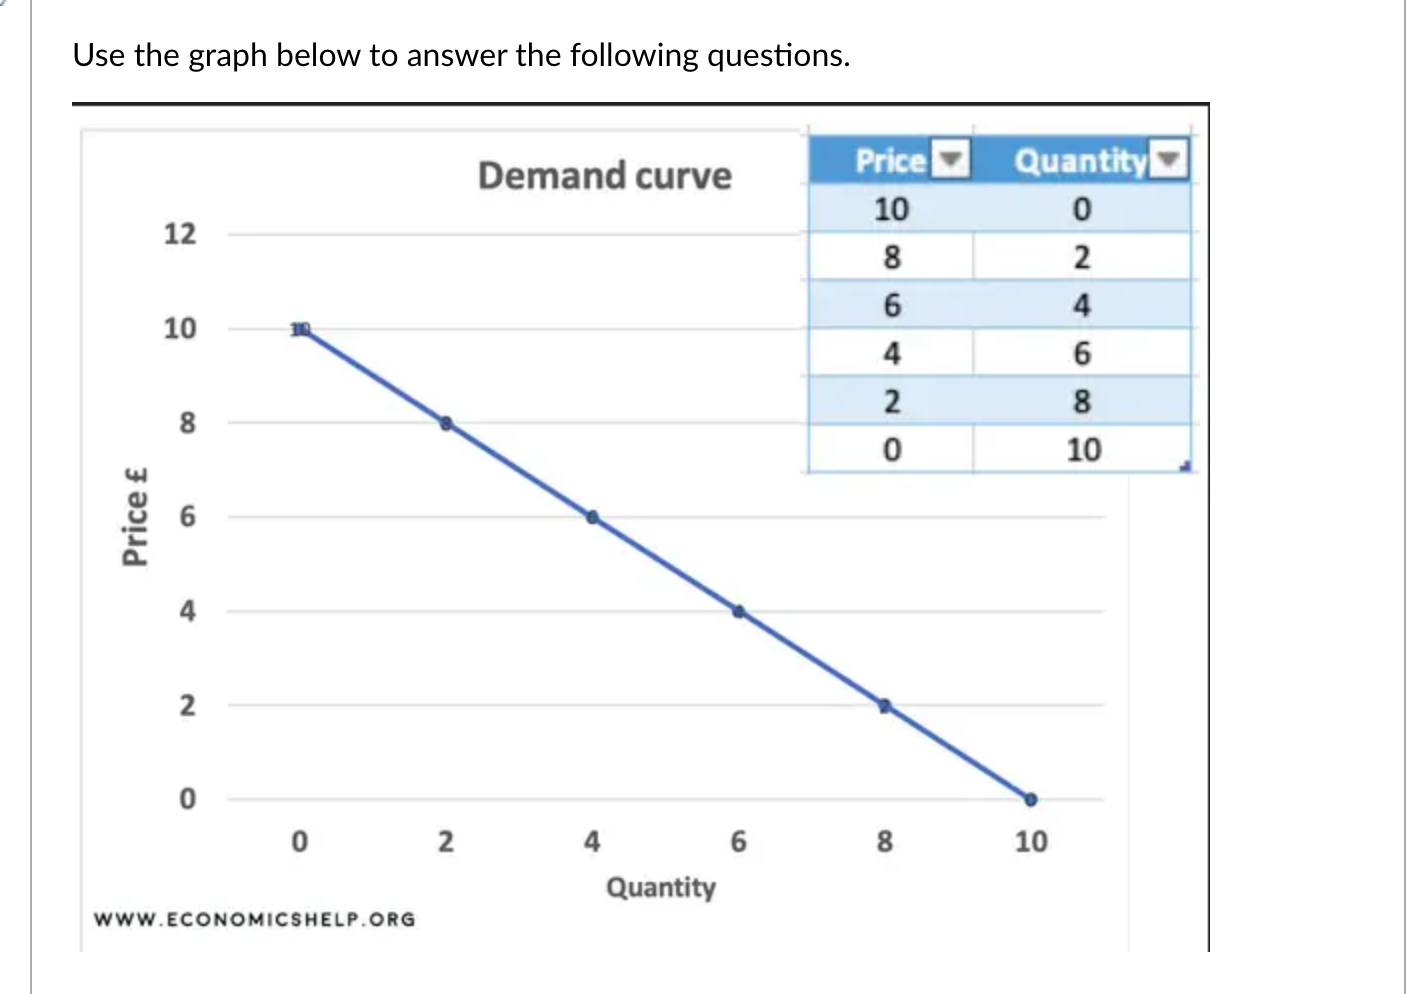
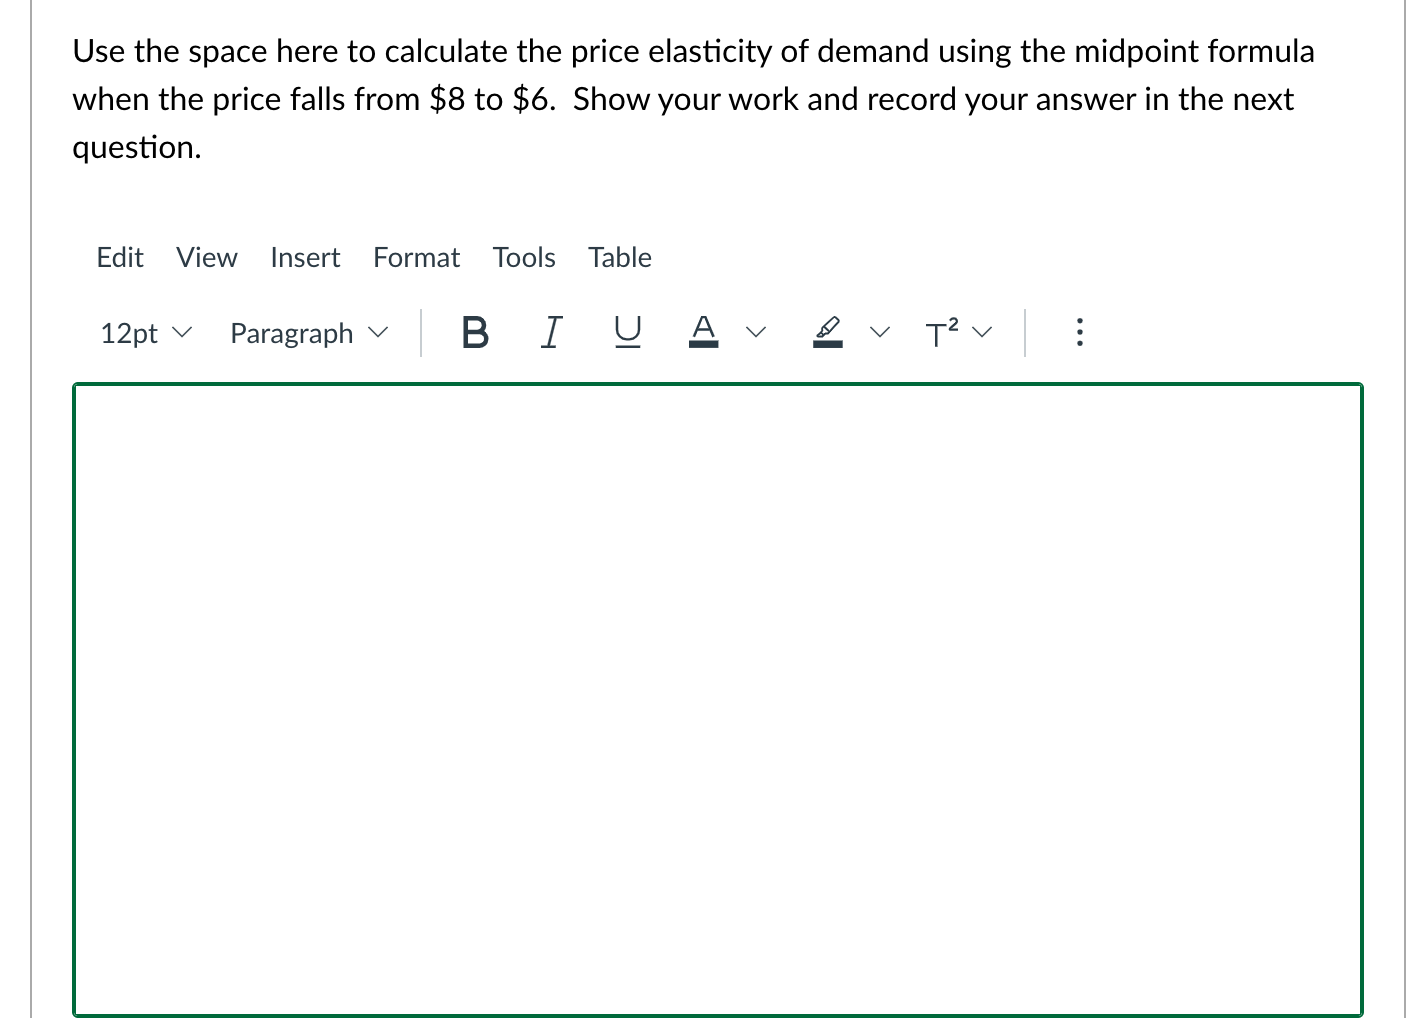
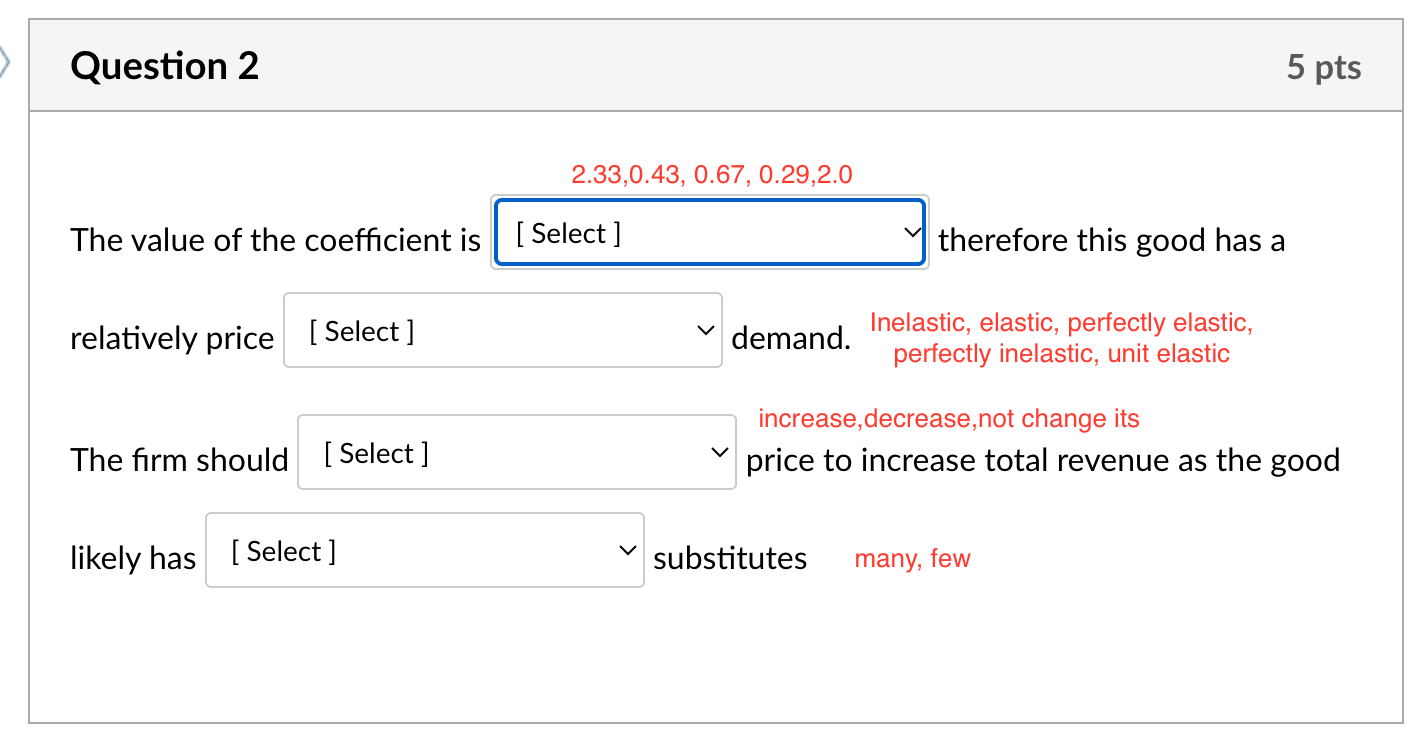
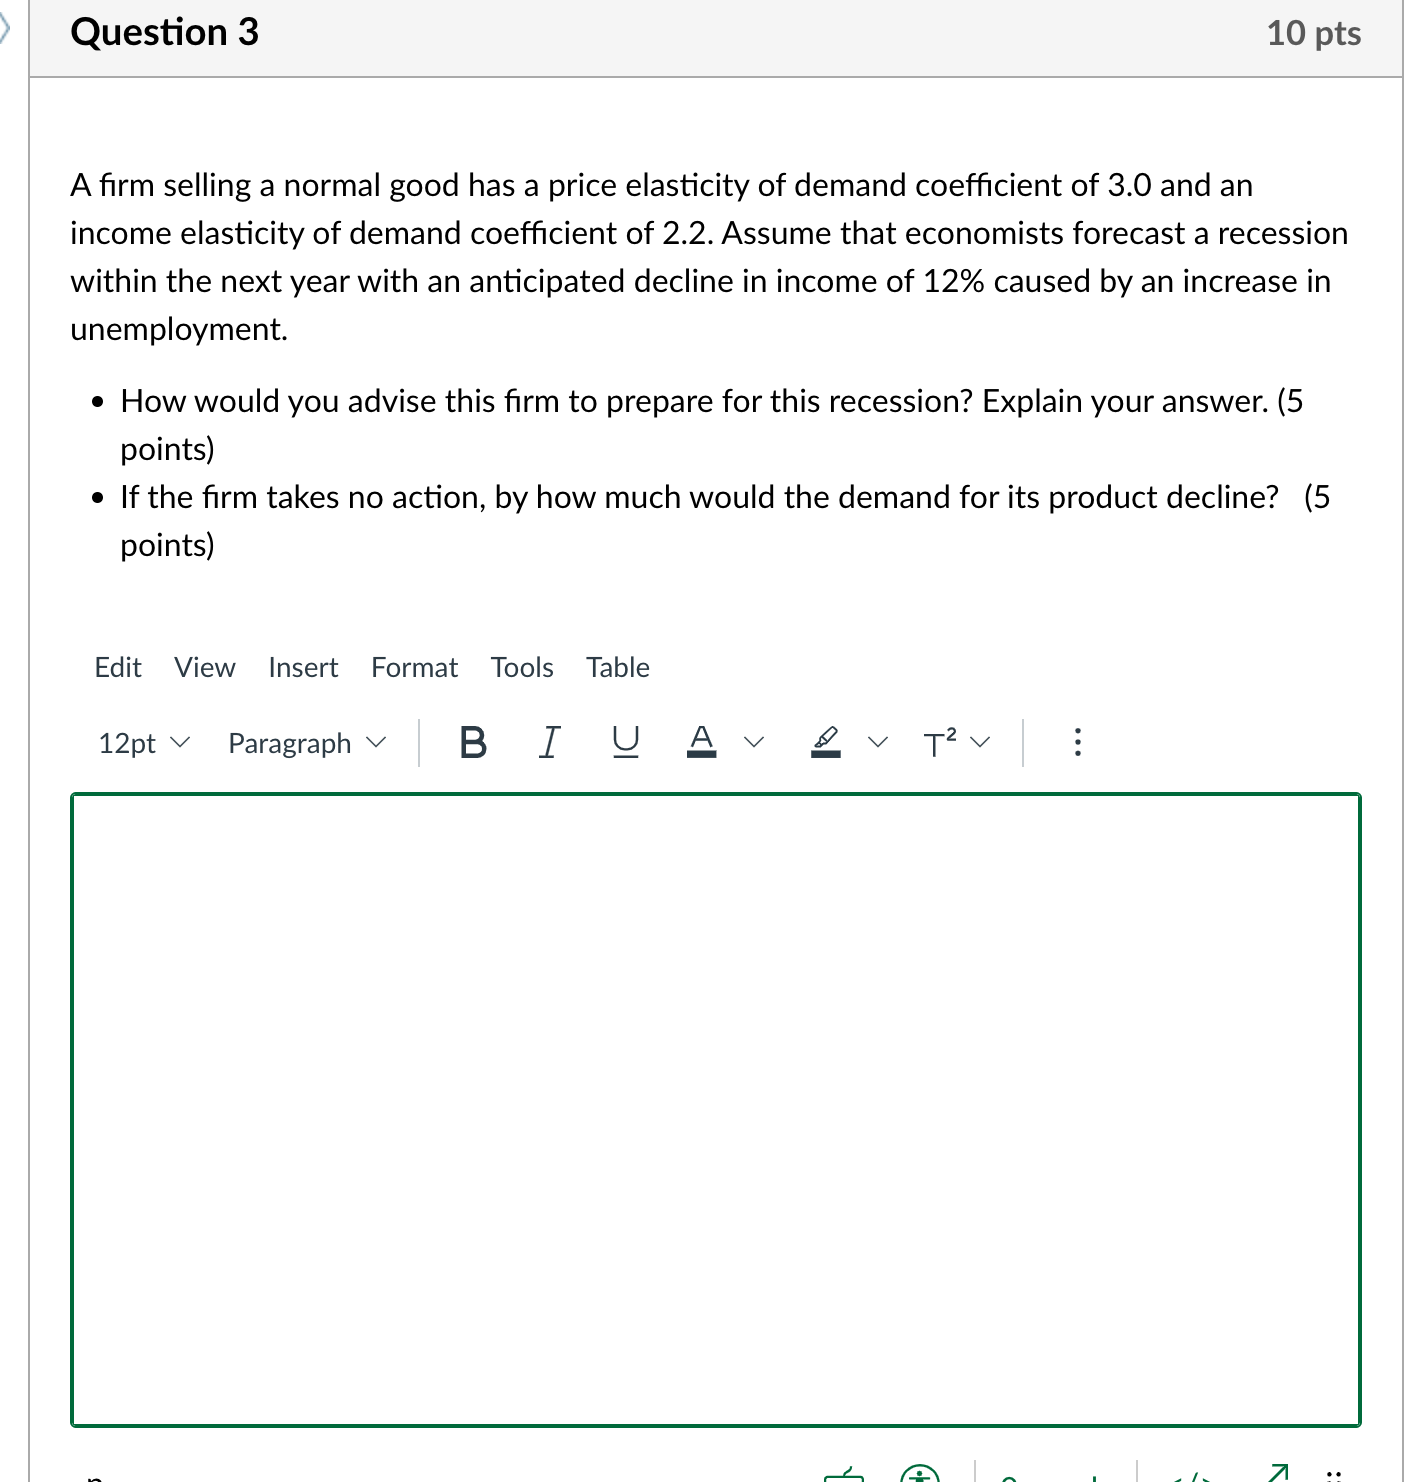
Use the graph below to answer the following questions. Demand curve Price Quantity 12 10 0 8 2 10 6 4 4 6 8 8 ON 10 Price E 6 P N 0 0 2 4 6 8 10 Quantity WWW. ECONOMICSHELP.ORGUse the space here to calculate the price elasticity of demand using the midpoint formula when the price falls from $8 to $6. Show your work and record your answer in the next question. Edit View Insert Format Tools Table 12pt v Paragraph v B J U Av v T2v Question 2 5 pts 2.33,0.43, 0.67,0.29,2.0 The value of the coefficient is therefore this good has a Inelastic, elastic, perfectly elastic, ; i Select v relatively price [ ] demand. perfectly inelastic, unit elastic increase,decrease,not change its The firm should [ Select] price to increase total revenue as the good likely has [ Select] v substitutes many, few Question 3 10 pts A firm selling a normal good has a price elasticity of demand coefficient of 3.0 and an income elasticity of demand coefficient of 2.2. Assume that economists forecast a recession within the next year with an anticipated decline in income of 12% caused by an increase in unemployment. e How would you advise this firm to prepare for this recession? Explain your answer. (5 points) e If the firm takes no action, by how much would the demand for its product decline? (5 points) Edit View Insert Format Tools Table 12pt v Paragraph v B /7 U A+v v T1T2v
Step by Step Solution
There are 3 Steps involved in it

Get step-by-step solutions from verified subject matter experts