

Question: Use the graph below to explain the output, profit and loss conditions for monopolistically competitive firms. With examples, examine the barriers to business entry for
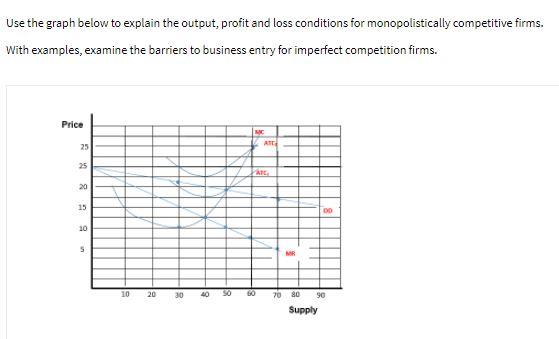
Use the graph below to explain the output, profit and loss conditions for monopolistically competitive firms. With examples, examine the barriers to business entry for imperfect competition firms. Price 25 ATT 25 20 15 00 20 5 MR 10 20 30 40 & 70 80 90 Supply
Step by Step Solution
There are 3 Steps involved in it
1 Expert Approved Answer
Step: 1 Unlock

Question Has Been Solved by an Expert!
Get step-by-step solutions from verified subject matter experts
Step: 2 Unlock
Step: 3 Unlock