

Question: Use the graph below to state a the domain b range c where it is increasing d and decreasing using interval notation e x intercepts

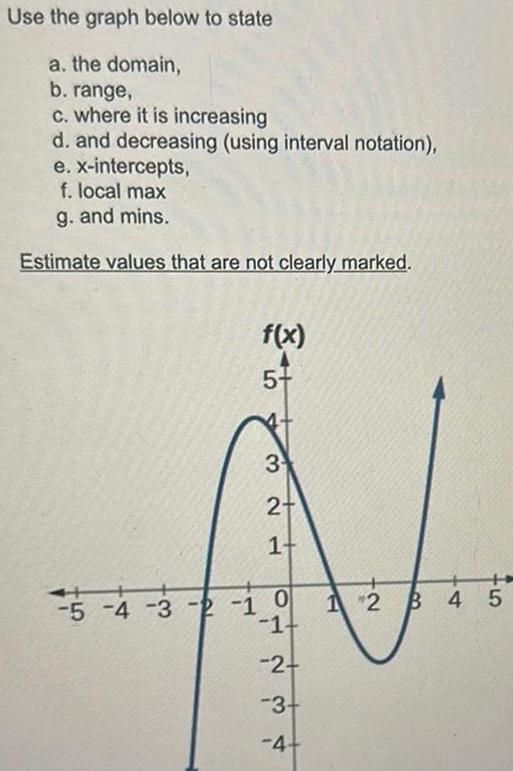
Use the graph below to state a the domain b range c where it is increasing d and decreasing using interval notation e x intercepts f local max g and mins Estimate values that are not clearly marked f x 5 3 2 1 5 4 3 2 1 0 1 2 3 4 12 B 45
Step by Step Solution
There are 3 Steps involved in it
1 Expert Approved Answer
Step: 1 Unlock

Question Has Been Solved by an Expert!
Get step-by-step solutions from verified subject matter experts
Step: 2 Unlock
Step: 3 Unlock