

Question: Use the graph of the function f(x) to locate the local extrema and identify the intervals where the function is concave up and concave down.
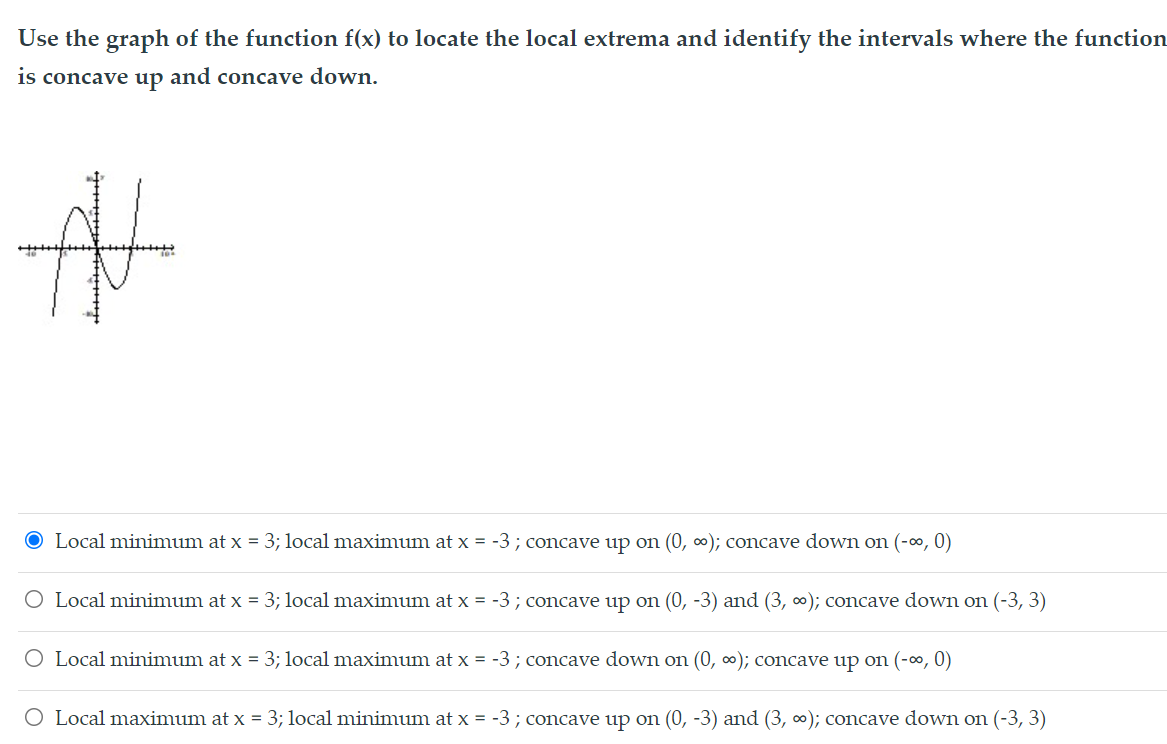

Use the graph of the function f(x) to locate the local extrema and identify the intervals where the function is concave up and concave down. O Local minimum at x = 3; local maximum at x = -3 ; concave up on (0, co); concave down on (-09, 0) O Local minimum at x = 3; local maximum at x = -3 ; concave up on (0, -3) and (3, co); concave down on (-3, 3) O Local minimum at x = 3; local maximum at x = -3 ; concave down on (0, co); concave up on (-oo, 0) O Local maximum at x = 3; local minimum at x = -3 ; concave up on (0, -3) and (3, co); concave down on (-3, 3)
Step by Step Solution
There are 3 Steps involved in it
1 Expert Approved Answer
Step: 1 Unlock

Question Has Been Solved by an Expert!
Get step-by-step solutions from verified subject matter experts
Step: 2 Unlock
Step: 3 Unlock