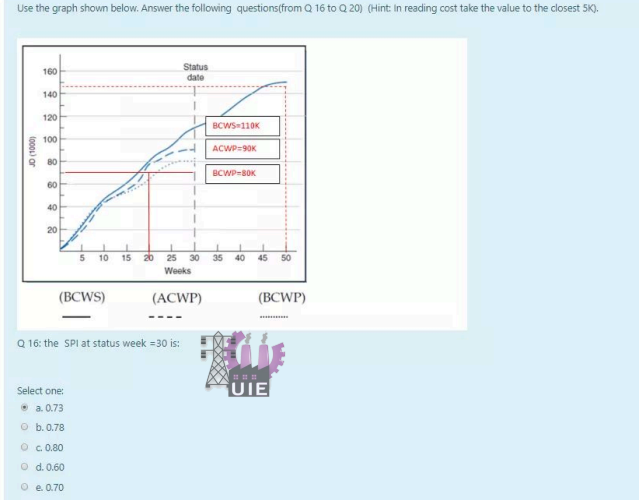
Question: Use the graph shown below. Answer the following questions from Q 16 to Q 20) (Hint: In reading cost take the value to the closest

Use the graph shown below. Answer the followingUse the graph shown below. Answer the followingUse the graph shown below. Answer the followingUse the graph shown below. Answer the followingUse the graph shown below. Answer the following

Use the graph shown below. Answer the following questions from Q 16 to Q 20) (Hint: In reading cost take the value to the closest 5K). 160 Status date 140 120 BCWS110K 100 100) or ACWP=90K BCWP BOK 60 40 20 5 10 15 20 35 40 45 50 25 30 Weeks (BCWS) (ACWP) (BCWP) Q 16: the SP at status week =30 is: UIE Select one: a. 0.73 b. 0.78 O C 0.80 O d. 0.60 0.0.70 The CPI at status week= 30 is Select one a. 0.85 O b. 0.74 c. 0.80 d. 0.63 e. 0.89 The Forecasted cost at competition is Select one: a. 228,600JD . b. 128,500JD c. 207,600JD d. 228,000JD e. 228,652JD U The Revised week of completion is I Select one: a. 77 weeks b. 68 weeks c. 75 weeks d. 80 weeks . e. 71 weeks The Budgeted Cost of the Work Performed is the cost of Select one: a. completed work packages b. open work packages c. overhead cost d. a and b e all WIF

Step by Step Solution

There are 3 Steps involved in it

1 Expert Approved Answer
Step: 1 Unlock blur-text-image
Question Has Been Solved by an Expert!

Get step-by-step solutions from verified subject matter experts

Step: 2 Unlock
Step: 3 Unlock

Students Have Also Explored These Related General Management Questions!