

Question: Use the graph to answer the question that follows. 100 80 Percentage of Income 2020 10 2015 20 2010 20 40 60 80 100 Percentage
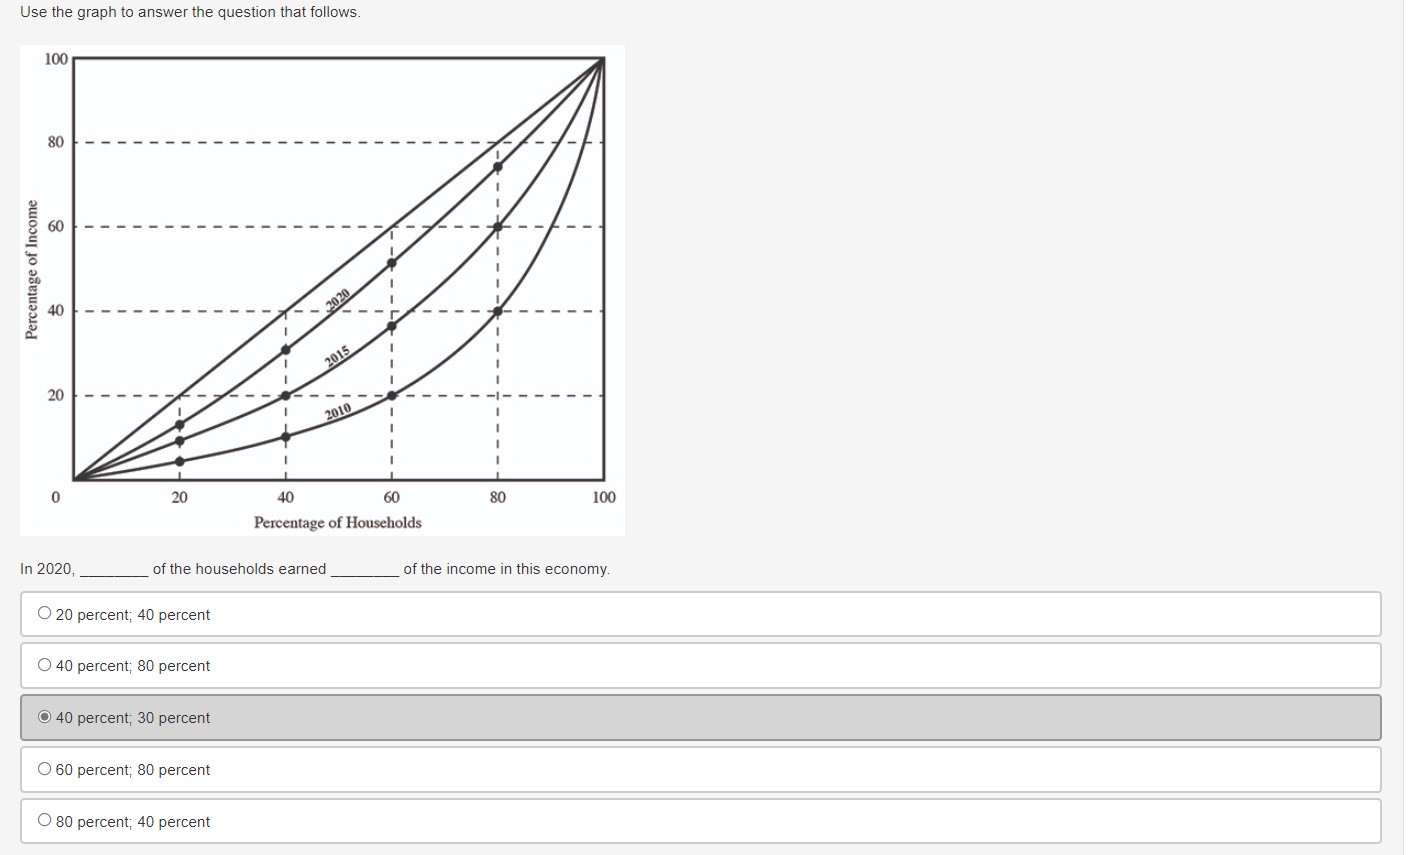
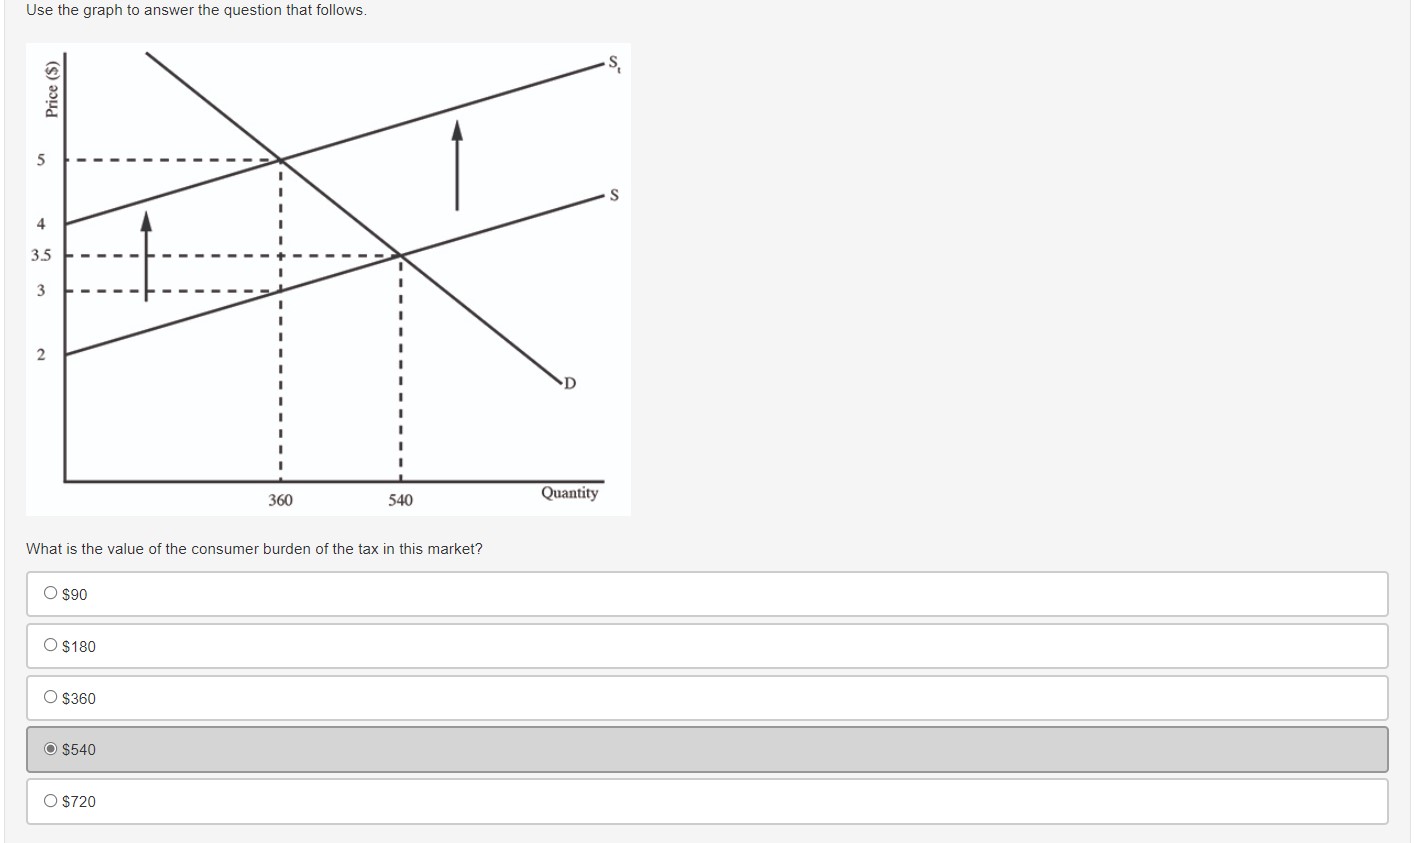


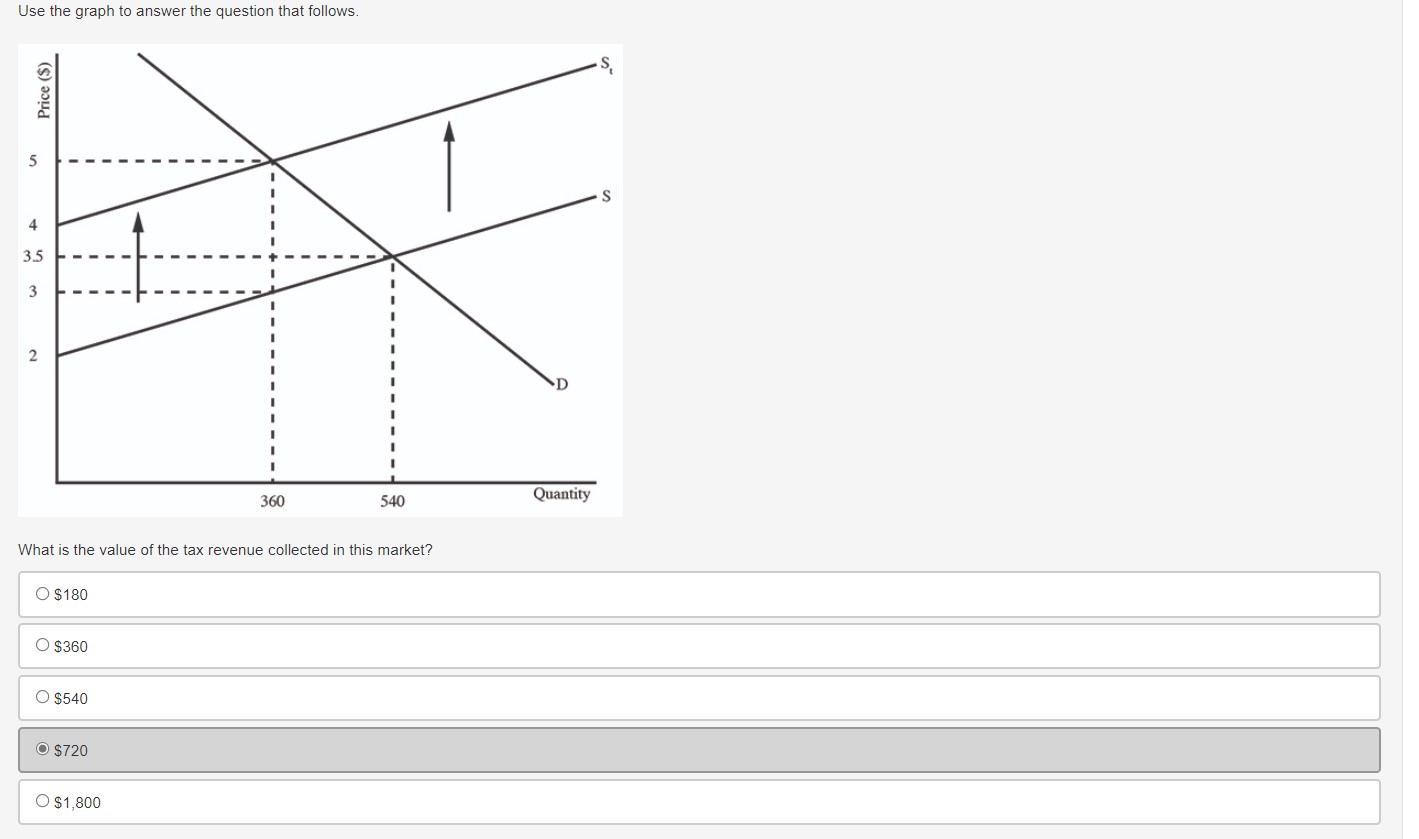
Use the graph to answer the question that follows. 100 80 Percentage of Income 2020 10 2015 20 2010 20 40 60 80 100 Percentage of Households In 2020, of the households earned of the income in this economy. O 20 percent; 40 percent 40 percent; 80 percent 40 percent; 30 percent O 60 percent; 80 percent 80 percent; 40 percentUse the graph to answer the question that follows. Price ($) A 3.5 2 360 540 Quantity What is the value of the consumer burden of the tax in this market? O $90 O $180 O $360 O $540 O $720Use the graph to answer the question that follows. Price ($) S 3.5 3 2 360 540 Quantity What is the value of the tax revenue collected in this market? O $180 $360 O $540 O $720 $1,800
Step by Step Solution
There are 3 Steps involved in it

Get step-by-step solutions from verified subject matter experts